How to Build a Snowflake Dashboard in SQL: An Ultimate Guide

Jim Kutz
August 4, 2025
20 min read

Summarize with ChatGPT

Interactive dashboards are essential for businesses to assess performance and make strategic decisions quickly. By transforming complex data into an easy-to-understand visual format, dashboards help you track KPIs, observe trends, identify outliers and support data-driven decisions.

Snowflake, a leading cloud-based data-warehouse platform, offers a unified interface to build dynamic dashboards with SQL, enabling real-time monitoring and in-depth analysis through its modern Snowsight interface.

This comprehensive guide walks you through constructing a professional Snowflake dashboard in SQL, covering everything from basic creation to advanced optimization techniques that ensure optimal performance and cost efficiency.

What Are Snowflake Dashboards and How Do They Work?

Snowflake dashboards visualize data by querying tables stored in your Snowflake database through Snowsight, the platform's modern web interface that has completely replaced the legacy Classic Console. Snowsight provides a comprehensive dashboard creation environment that combines Snowflake's powerful compute capabilities with intuitive visualization tools.

The dashboard architecture centers around tiles, which are individual visualization components that display query results in various formats including charts, tables, scorecards, heat grids, and scatterplots. Each tile connects directly to SQL worksheets, creating a seamless relationship between your query logic and visual presentations. This architecture enables real-time data visualization while maintaining the full power of Snowflake's analytical processing capabilities.

Snowsight's tile-based approach allows for flexible dashboard layouts where you can arrange multiple visualizations to tell comprehensive data stories. The platform supports interactive filtering, parameter-driven queries, and collaborative sharing features that enable team-based analytics workflows. Unlike external business intelligence tools, Snowsight dashboards operate entirely within Snowflake's security perimeter, ensuring consistent governance and access control across all analytical activities.

The modern Snowsight interface includes enhanced navigation, improved search functionality, and workspace capabilities that support complex analytical projects spanning multiple files and programming languages. These developments represent a significant evolution from basic visualization tools to comprehensive analytical environments that compete with dedicated business intelligence platforms.

Why Should You Build Your Snowflake Dashboard with SQL?

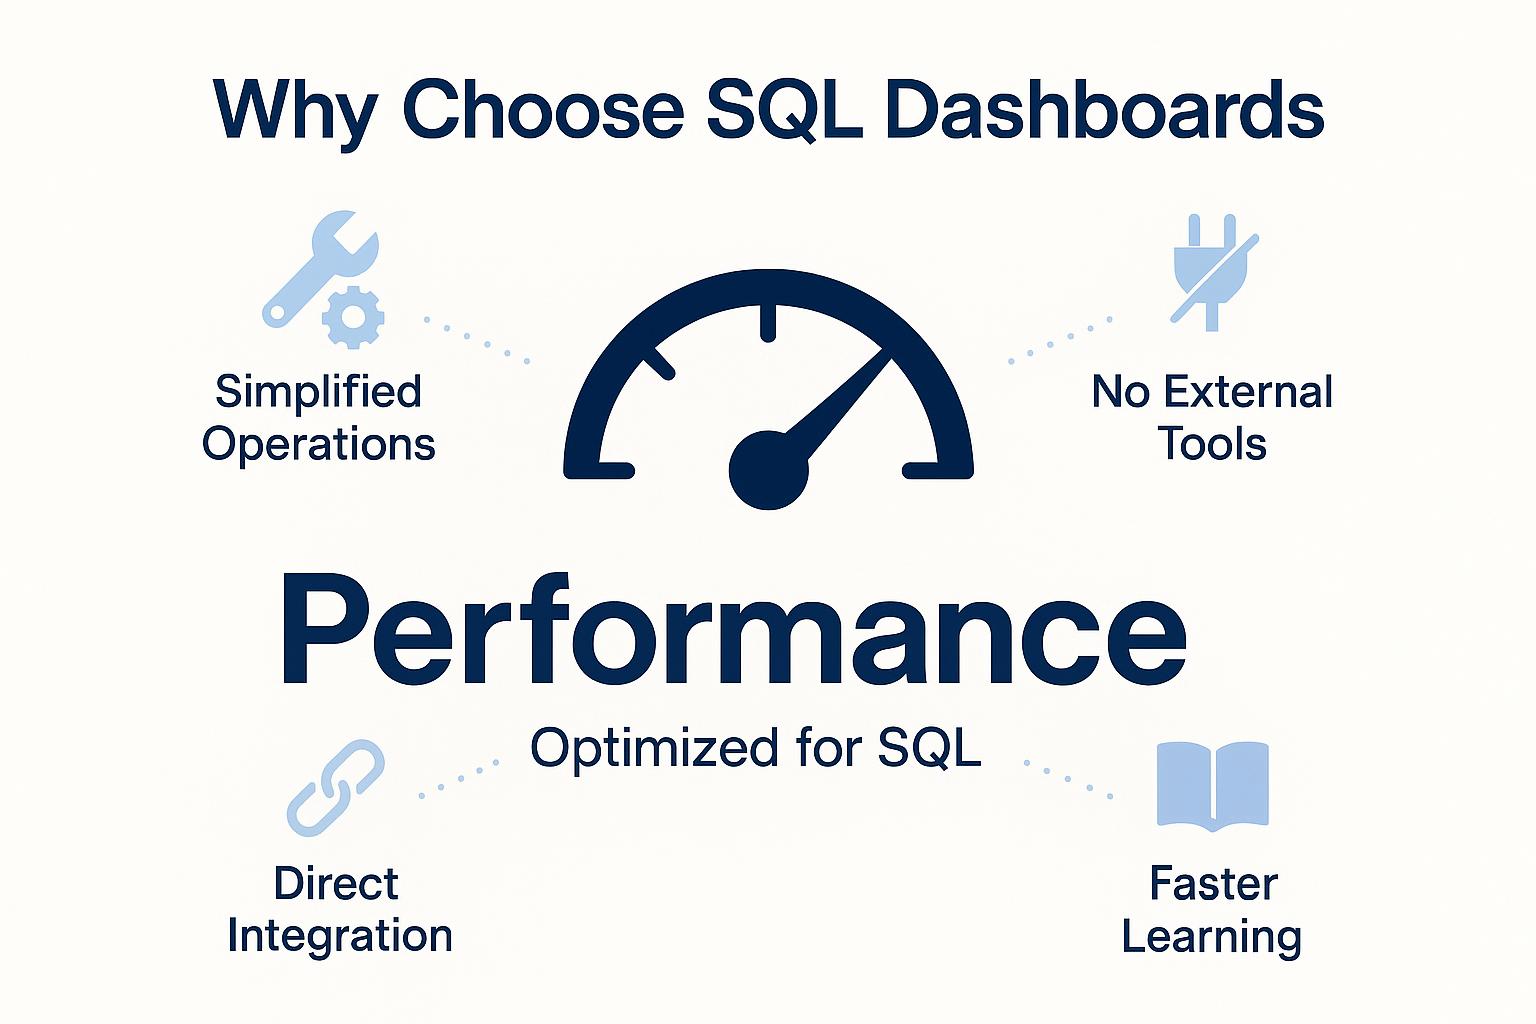
Building Snowflake dashboards with SQL provides numerous advantages that make it the preferred approach for data professionals working within the Snowflake ecosystem. SQL's purpose-built design for data manipulation aligns perfectly with dashboard requirements, offering unmatched efficiency for filtering, aggregating, and joining operations that power interactive visualizations.

Performance optimization represents one of the most compelling reasons to choose SQL for Snowflake dashboard development. Snowflake's architecture is specifically tuned for SQL execution, leveraging columnar storage, micro-partitioning, and automatic query optimization to deliver exceptional performance at scale. SQL queries benefit from Snowflake's result caching, warehouse scaling, and search optimization services, ensuring responsive dashboard experiences even with large datasets.

Simplified data operations through SQL's declarative syntax make complex analytical operations more intuitive and maintainable. Built-in functions for window operations, time-series analysis, and statistical computations eliminate the need for external processing libraries while providing enterprise-grade performance and reliability.

Reduced dependency on external tools streamlines the entire dashboard development workflow by keeping all operations within the Snowflake environment. This approach eliminates data movement, reduces latency, and simplifies security management while providing access to Snowflake's advanced features like materialized views, time travel and cloning.

Direct integration with Snowflake features enables sophisticated analytical capabilities that external tools cannot easily replicate. You can leverage Dynamic Tables for automated refresh operations, Streams for change data capture, and Tasks for scheduled processing workflows, all while maintaining consistent security and governance policies.

Faster learning curve makes SQL-based dashboard development accessible to broader teams within organizations. SQL's ubiquity means that analysts, data engineers, and business intelligence professionals can contribute to dashboard development without learning proprietary languages or specialized development environments.

What Do You Need to Get Started with Snowflake Dashboard Development?

Before beginning your Snowflake dashboard development journey, ensure you have the necessary prerequisites in place for a smooth and successful implementation. These requirements span both technical access and skill development areas that will enable effective dashboard creation.

Snowflake account access with appropriate permissions forms the foundation of dashboard development. You need permissions to query target databases and schemas, create worksheets and dashboards, and share content with other users. For enterprise implementations, coordinate with your Snowflake administrator to ensure proper role assignments and warehouse access that align with your organization's governance policies.

SQL proficiency at basic to intermediate levels enables effective dashboard query development. You should be comfortable with SELECT statements, filtering operations, JOIN clauses, GROUP BY aggregations, and basic window functions. More advanced features like common table expressions, recursive queries, and user-defined functions can enhance dashboard sophistication but are not required for initial implementations.

Existing Snowflake database with relevant data provides the content foundation for meaningful dashboards. If you don't have existing data, consider using Snowflake's sample datasets like SNOWFLAKESAMPLEDATA to practice dashboard development techniques before working with production data.

Understanding of your business requirements helps guide dashboard design decisions including which metrics to display, how users will interact with visualizations, and what performance characteristics are necessary for successful adoption. Consider user personas, access patterns, and integration requirements with existing business processes.

Basic knowledge of data visualization principles enhances dashboard effectiveness even when working within Snowsight's constraints. Understanding concepts like visual hierarchy, color usage, and chart type selection helps create dashboards that communicate insights effectively rather than simply displaying data.

How Do You Create a Snowflake Dashboard Step-by-Step?

Accessing the Snowsight Interface and Initial Setup

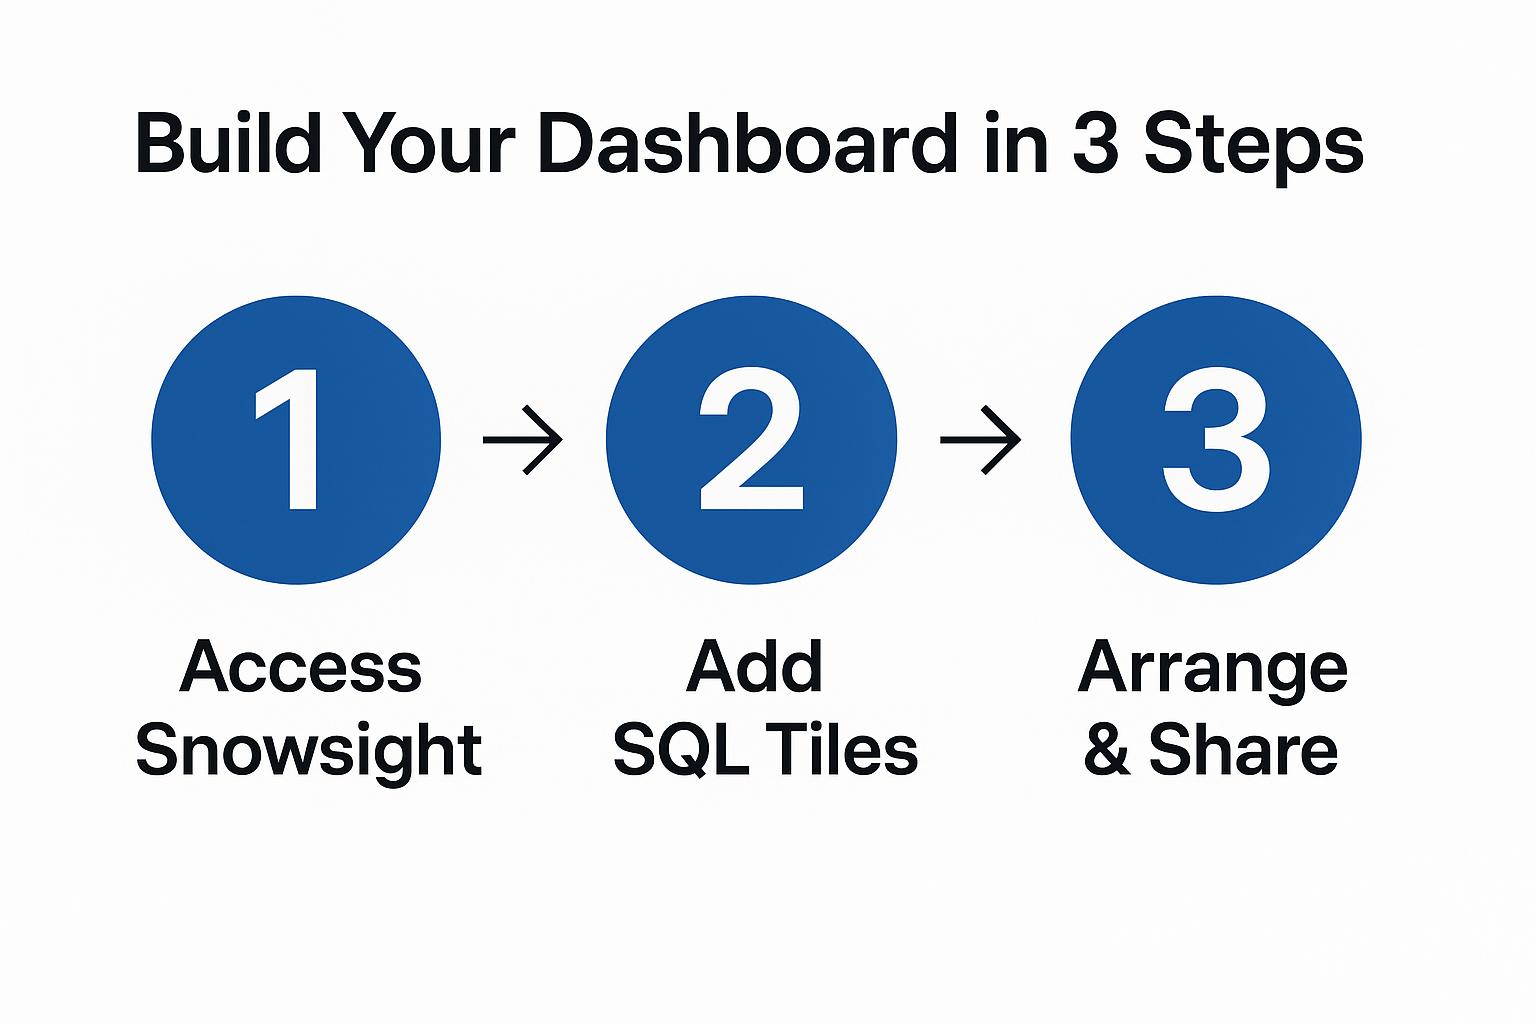
Begin your dashboard development by logging into Snowflake and navigating to the Snowsight interface, which serves as your primary development environment. From the main navigation menu, locate the dashboard creation options through multiple pathways: click + Create → Dashboards for direct access, or navigate through Projects → Dashboards → + Dashboard for project-organized development workflows.

When creating your new dashboard, provide a descriptive name that reflects its purpose and intended audience. This naming convention becomes important for organization and sharing as your dashboard library grows. After clicking Create Dashboard, you enter the dashboard editing environment where you can begin adding visualization tiles and configuring interactive elements.

The initial setup phase includes configuring your session context by setting appropriate roles and warehouse assignments. For development work, ensure your role has sufficient permissions for target databases and schemas, while selecting warehouse sizes that balance performance needs with cost considerations during the development process.

Adding and Configuring Dashboard Tiles

Dashboard tiles represent individual visualization components that display query results in various chart formats. To add your first tile, click New Tile → From SQL Worksheet to access the integrated worksheet editor where you develop the underlying SQL queries that power your visualizations.

Configure your worksheet environment by selecting the appropriate database and schema context. For practice and learning, the SNOWFLAKE_SAMPLE_DATA.TPCH_SF1 schema provides comprehensive sample data that demonstrates various dashboard techniques. Begin with straightforward queries that demonstrate key business metrics:

SELECT
  c_mktsegment,
  COUNT(*) AS customer_count,
  AVG(c_acctbal) AS avg_account_balance
FROM
  customer
GROUP BY
  c_mktsegment
ORDER BY
  customer_count DESC;

After executing your query with the Run button, switch to the Chart tab to configure visualization settings. Snowsight automatically suggests appropriate chart types based on your data characteristics, but you can customize chart selection, axis configurations, color schemes, and labeling to match your presentation requirements.

The tile configuration process includes setting descriptive titles, configuring data refresh behavior, and establishing any parameters that enable interactive filtering. Once satisfied with both the query logic and visualization appearance, save the tile by clicking Return to [Dashboard Name] to add it to your dashboard layout.

Dashboard Layout and Organization

After creating multiple tiles, organize your dashboard layout through Snowsight's drag-and-drop interface that enables intuitive arrangement of visualization components. Consider logical groupings that guide users through your data story, placing related metrics near each other and establishing visual hierarchy through tile sizing and positioning.

Dashboard organization should reflect user workflows and decision-making processes. Primary KPIs might occupy prominent positions at the dashboard top, while supporting details and drill-down information appear in secondary positions. The tile sizing options enable emphasis of critical metrics while maintaining space efficiency for comprehensive dashboards with multiple visualization components.

Interactive elements like filters and parameters enhance dashboard utility by enabling user customization without requiring multiple static dashboards. Configure filters that apply across multiple tiles to create cohesive interactive experiences where users can explore data from different perspectives while maintaining consistent filtering logic.

How Can AI-Powered Features Enhance Your Snowflake Dashboard Development?

Artificial intelligence integration represents one of the most transformative developments in modern Snowflake dashboard creation, fundamentally changing how users interact with data and develop analytical insights. Snowflake Copilot and Cortex AI services provide sophisticated capabilities that democratize advanced analytics while maintaining enterprise-grade security and governance standards.

Leveraging Snowflake Copilot for Intelligent Query Development

Snowflake Copilot transforms dashboard development by converting natural language requests into executable SQL queries, eliminating traditional barriers that required extensive SQL expertise for sophisticated analytical operations. This AI-powered assistant operates securely within the Snowflake environment, respecting all existing role-based access controls while providing intelligent suggestions based exclusively on datasets users can legitimately access.

The practical applications of Copilot in dashboard development extend far beyond simple query generation. Users can explore unfamiliar datasets by asking descriptive questions about table structures, data relationships, and available metrics. The system provides clear explanations of complex data patterns while suggesting optimization strategies that improve query performance and reduce compute costs.

Copilot excels at generating complex analytical queries including multi-table joins, window functions, and advanced aggregations that power sophisticated dashboard visualizations. Rather than manually constructing intricate SQL logic, developers can describe their analytical requirements in natural language and receive optimized query implementations that leverage Snowflake's architectural advantages.

The collaborative nature of Copilot enables iterative query development where users can refine requirements through conversational interfaces, receiving immediate feedback and alternative approaches for complex analytical challenges. This capability accelerates dashboard development while improving query quality through AI-powered optimization recommendations.

Implementing Semantic Intelligence with Cortex Analyst

Cortex Analyst introduces semantic intelligence capabilities that transform how dashboards understand and present business context rather than simply processing raw data values. Semantic views provide native database-level storage of business metadata including metrics definitions, dimensional relationships, and analytical context that ensure consistent interpretations across multiple dashboard applications.

The implementation of semantic views creates unified interfaces that serve both traditional business intelligence tools and AI-powered analytics surfaces simultaneously. This convergence ensures that existing dashboard reports maintain consistency with AI-enhanced analytical capabilities, addressing common enterprise challenges where different tools interpret identical data differently.

Semantic intelligence enables dashboard applications that adapt to user intentions rather than simply executing predefined queries. Users can ask business-oriented questions using domain-specific terminology, receiving responses that understand organizational context and apply appropriate business rules automatically without manual configuration for each analytical scenario.

The integration with Cortex Search services enhances semantic capabilities through retrieval-augmented generation that provides contextually relevant responses to natural language queries. Custom instructions embedded within semantic views ensure domain-specific accuracy while verified queries provide examples that improve response quality across diverse analytical use cases.

Advanced AI Integration Patterns

Modern dashboard applications can incorporate predictive analytics and machine learning insights directly within Snowflake through Cortex AI services that process both structured and unstructured data using standard SQL syntax. This capability enables dashboard visualizations that combine historical trends with predictive forecasts, providing comprehensive decision-making support within unified analytical interfaces.

Conversational analytics represents the future direction of dashboard interaction, where users engage with data through natural language conversations rather than traditional point-and-click interfaces. These capabilities enable non-technical users to perform sophisticated analyses while experienced analysts benefit from enhanced productivity through AI-assisted query development and optimization suggestions.

The democratization of advanced analytics through AI-powered interfaces expands the potential user base for sophisticated dashboard applications. Organizations can provide powerful analytical capabilities to broader user communities while maintaining enterprise security and governance standards through Snowflake's integrated AI services that operate within existing security perimeters.

What Are the Best Practices for Optimizing Snowflake Dashboard Performance and Costs?

Performance optimization and cost management represent critical success factors for Snowflake dashboard implementations, requiring sophisticated strategies that balance user experience requirements with operational efficiency. Effective optimization encompasses query design, resource allocation, caching strategies, and monitoring practices that ensure sustainable dashboard operations at enterprise scale.

Query Optimization Strategies for Dashboard Applications

SQL query optimization forms the foundation of effective Snowflake dashboard performance, requiring techniques that minimize data scanning while maximizing Snowflake's architectural advantages. Design queries that leverage Snowflake's columnar storage through selective column access, avoiding SELECT * statements that retrieve unnecessary data and increase processing overhead without providing analytical value.

Implement strategic filtering approaches that take advantage of Snowflake's micro-partitioning capabilities by placing highly selective conditions early in query execution. Time-based filtering proves particularly effective for dashboard applications that focus on recent data patterns, enabling automatic partition pruning that dramatically reduces data scanning requirements.

Leverage materialized views for frequently accessed dashboard queries that involve complex aggregations or multi-table joins. These pre-computed result sets provide substantial performance improvements while reducing compute costs through incremental maintenance patterns that process only changed data rather than full dataset refreshes.

Advanced optimization techniques include strategic use of clustering keys for tables that support multiple dashboard applications with predictable access patterns. Clustering keys organize micro-partitions to optimize common query patterns, providing performance improvements that compound across multiple dashboard users and concurrent access scenarios.

Cost Management and Resource Allocation

Warehouse optimization represents the most impactful area for controlling Snowflake dashboard costs, requiring careful balance between performance requirements and operational budget constraints. Implement auto-suspend configurations as aggressive as 60 seconds for interactive dashboard workloads that experience intermittent usage patterns, providing substantial cost savings without impacting user experience.

Dedicated warehouse strategies enable precise cost attribution and performance isolation for dashboard applications. Create separate warehouses for different dashboard user groups or application types, allowing granular resource management and cost control that prevents resource contention between operational and analytical workloads.

Resource monitoring through Snowflake's native capabilities provides essential visibility into dashboard cost drivers and optimization opportunities. Implement custom monitoring dashboards that track query execution patterns, warehouse utilization, and user activity metrics, providing early warning systems for unusual consumption patterns or performance degradation.

Query result caching optimization can reduce dashboard costs by up to 90% for appropriate use cases by eliminating repeated execution of identical queries. Standardize dashboard query patterns to maximize cache hit ratios while avoiding cache-busting functions that prevent effective caching strategies.

Performance Monitoring and Troubleshooting

Systematic performance monitoring enables proactive optimization and rapid resolution of dashboard performance issues before they impact user productivity. Implement comprehensive monitoring frameworks that track query execution times, warehouse utilization patterns, and user interaction metrics to identify optimization opportunities and potential bottlenecks.

Dashboard loading performance requires particular attention when multiple tiles execute simultaneously, as sequential refresh operations can compound individual query performance issues into unacceptable overall load times. Optimize tile refresh strategies through staggered loading patterns and strategic use of cached results for non-critical visualizations.

Common performance challenges include inefficient joins that scan large datasets unnecessarily, missing or inappropriate clustering keys that prevent effective partition pruning, and suboptimal warehouse sizing that creates resource contention during peak usage periods. Develop systematic troubleshooting procedures that address these common scenarios through query profiling, warehouse analysis, and user behavior assessment.

Advanced troubleshooting techniques leverage Snowflake's query profiling capabilities to identify specific optimization opportunities including partition pruning effectiveness, join strategies, and resource utilization patterns. These tools provide detailed insights that enable targeted optimization efforts rather than general performance improvements that may not address specific bottlenecks.

How Can You Use Airbyte to Populate Snowflake for Dashboard Development?

Building meaningful dashboards requires clean, centralized data that is often scattered across multiple systems throughout modern organizations. Airbyte and its Python library PyAirbyte provide comprehensive solutions for consolidating diverse data sources into Snowflake, creating the foundation for sophisticated dashboard applications.

Understanding PyAirbyte's Role in Dashboard Data Preparation

PyAirbyte simplifies the complex process of extracting data from diverse sources and loading it into Snowflake tables optimized for dashboard queries. The platform supports over 600 pre-built connectors covering databases, APIs, files, and SaaS applications, enabling comprehensive data consolidation without custom development overhead.

The typical workflow involves extracting data from operational systems like GitHub, PostgreSQL, CoinAPI, or Shopify, applying optional transformations using Pandas, and loading the processed data into Snowflake tables ready for dashboard visualization. This approach ensures that dashboard queries operate against clean, consistently formatted data rather than requiring complex transformation logic within visualization queries.

PyAirbyte's integration with Snowflake includes sophisticated features like change data capture for real-time synchronization, schema evolution handling for maintaining data consistency during structural changes, and cost optimization through efficient data loading patterns that minimize Snowflake compute consumption.

Practical Implementation Example

Consider a comprehensive example that demonstrates extracting cryptocurrency market data for financial dashboard applications:

# 1. Install PyAirbyte with Snowflake support
pip install pyairbyte[snowflake]

# 2. Configure Snowflake destination
from pyairbyte import Airbyte
sf_cache = Airbyte(
    destination_type="snowflake",
    account="YOUR_ACCOUNT",
    database="YOUR_DB",
    warehouse="COMPUTE_WH",
    user="YOUR_USER",
    password="YOUR_PASSWORD",
    role="ACCOUNTADMIN",
)

# 3. Connect CoinAPI source
source = sf_cache.connect_source(
    source_type="coinapi",
    api_key="YOUR_COINAPI_KEY"
)

# 4. Synchronize data to Snowflake
source.sync()

# 5. Apply business transformations
ohlcv_df = source.read("ohlcv")
# Calculate technical indicators, normalize formats, apply business rules
ohlcv_df['price_change_pct'] = (ohlcv_df['price_close'] - ohlcv_df['price_open']) / ohlcv_df['price_open'] * 100

# 6. Load processed data into dashboard-ready tables
ohlcv_df.to_sql("coinapi_ohlcv", sf_cache.sql_engine(), if_exists="replace", index=False)

This processed data becomes immediately available for SQL queries and dashboard visualization within Snowsight, eliminating manual data preparation steps while ensuring consistent data quality and format standards.

Advanced Integration Patterns

Airbyte's extensive connector ecosystem enables sophisticated dashboard architectures that consolidate data from multiple business domains into comprehensive analytical environments. Organizations can implement unified customer 360 dashboards by combining data from CRM systems, marketing automation platforms, customer support tools, and financial systems within single Snowflake environments.

The platform's support for incremental synchronization and change data capture enables near real-time dashboard updates that reflect current business conditions without requiring expensive full-refresh operations. This capability proves essential for operational dashboards that support time-sensitive decision-making processes across sales, marketing, and customer service functions.

Enterprise implementations benefit from Airbyte's governance capabilities including role-based access control, audit logging, and data lineage tracking that ensure dashboard data meets organizational compliance and quality standards. These features enable confident dashboard deployment across regulated industries and sensitive business applications.

What Are Some Advanced Use Cases for Snowflake Dashboard Integration?

Beyond basic dashboard creation, Airbyte enables sophisticated analytical applications that demonstrate the full potential of integrated data ecosystems. These advanced use cases illustrate how comprehensive data integration supports complex business intelligence requirements across diverse industries and analytical scenarios.

Slack Analytics Dashboard implementations extract comprehensive workspace communication data through Airbyte's Slack connector, loading it into PostgreSQL for detailed analysis and visualization through Apache Superset. These dashboards provide insights into team collaboration patterns, message frequency analysis, and communication network visualization that support organizational efficiency initiatives.

GitHub Activity Dashboard projects leverage GitHub project metrics extracted through Airbyte connectors, storing development activity data in PostgreSQL for exploration through Metabase visualization tools. These implementations track code contribution patterns, repository activity trends, and developer productivity metrics that inform software development process optimization.

Multi-Cloud Cost Management Dashboard scenarios utilize Airbyte's cloud provider connectors to consolidate billing and usage data from AWS, Azure, and Google Cloud platforms into unified Snowflake environments. These dashboards enable comprehensive cost attribution, resource optimization identification, and multi-cloud spending pattern analysis that supports strategic infrastructure decisions.

Airbyte's catalog of 600+ connectors, enhanced by AI-assisted Connector Builder capabilities, accelerates data movement for virtually any dashboard workflow imaginable. The platform's open-source foundation combined with enterprise-grade security ensures that organizations can implement sophisticated analytical applications without vendor lock-in concerns or prohibitive licensing costs.

These advanced implementations demonstrate how comprehensive data integration enables dashboard applications that span beyond simple visualization into strategic business intelligence that drives competitive advantage through unified data access and sophisticated analytical capabilities.

Frequently Asked Questions

What types of visualizations can I create in Snowflake dashboards?

Snowsight supports multiple visualization types including bar charts, line charts, pie charts, scatter plots, heat grids, tables, and scorecards. While the selection is more limited than dedicated BI tools, these chart types cover most common dashboard requirements. You can customize colors, labels, axes, and grouping options to create professional-looking visualizations that effectively communicate your data insights.

How much does it cost to run Snowflake dashboards?

Snowflake dashboard costs depend on compute usage, storage, and query complexity. Interactive dashboards typically use X-Small to Small warehouses costing $1-4 per hour of active compute time. With proper optimization including auto-suspend settings, result caching, and efficient queries, most dashboard applications cost $50-500 per month depending on usage patterns and data volumes.

Can I share Snowflake dashboards with external users?

Snowflake dashboards can be shared with other Snowflake users within your organization through username-based invitations or "People with link" sharing options. However, sharing with external users requires them to have Snowflake accounts with appropriate access permissions. For external sharing, consider exporting visualizations or using embedded analytics solutions.

How do I troubleshoot slow-loading dashboard tiles?

Slow dashboard performance typically results from inefficient queries, inappropriate warehouse sizing, or missing optimization features. Use Snowflake's Query Profile to analyze execution plans, implement clustering keys for frequently filtered columns, leverage materialized views for complex aggregations, and ensure auto-suspend is configured appropriately. Monitor warehouse utilization to identify resource constraints.

What happens to my dashboards when Snowflake schema changes occur?

Snowflake dashboards automatically detect schema changes and may pause synchronization to prevent errors. Breaking changes like removed columns or modified data types require manual intervention to update affected queries. Implement systematic schema change management processes and consider using views or semantic layers to isolate dashboards from direct table structure dependencies.

Limitless data movement with free Alpha and Beta connectors
Introducing: our Free Connector Program
The data movement infrastructure for the modern data teams.
Try a 14-day free trial