Data Monitoring and Observability: Modern vs Legacy Platform Capabilities
Summarize this article with:
✨ AI Generated Summary
Modern data observability platforms provide real-time correlation of metrics, logs, and traces, enabling faster root cause analysis and proactive issue detection compared to legacy batch monitoring. Key benefits include:
- Unified control plane architecture for continuous telemetry and reduced dashboard sprawl.
- Machine learning-driven anomaly detection to identify subtle data drifts and unknown problems.
- Built-in compliance features with immutable audit logs and fine-grained access controls.
- Cloud-native integrations and scalable performance across hybrid environments.
- Airbyte Flex offers hybrid deployment with data plane control, OpenTelemetry integration, and compliance-ready audit logs, supporting rapid production deployment without feature trade-offs.
Modern data observability platforms correlate metrics, logs, and traces in real time across your entire infrastructure, replacing legacy batch monitoring that detects pipeline failures hours after they occur.
Data teams at financial services firms spend significant time managing silent pipeline failures. This delayed detection exposes organizations to compliance penalties and operational risk.
These monitoring gaps often stem from the limits of traditional data integration solutions, which weren’t designed for real-time telemetry or cross-cloud observability. To close these gaps, data teams are turning to observability platforms that reveal not just when something fails, but also why.
What Is the Difference Between Monitoring and Observability?

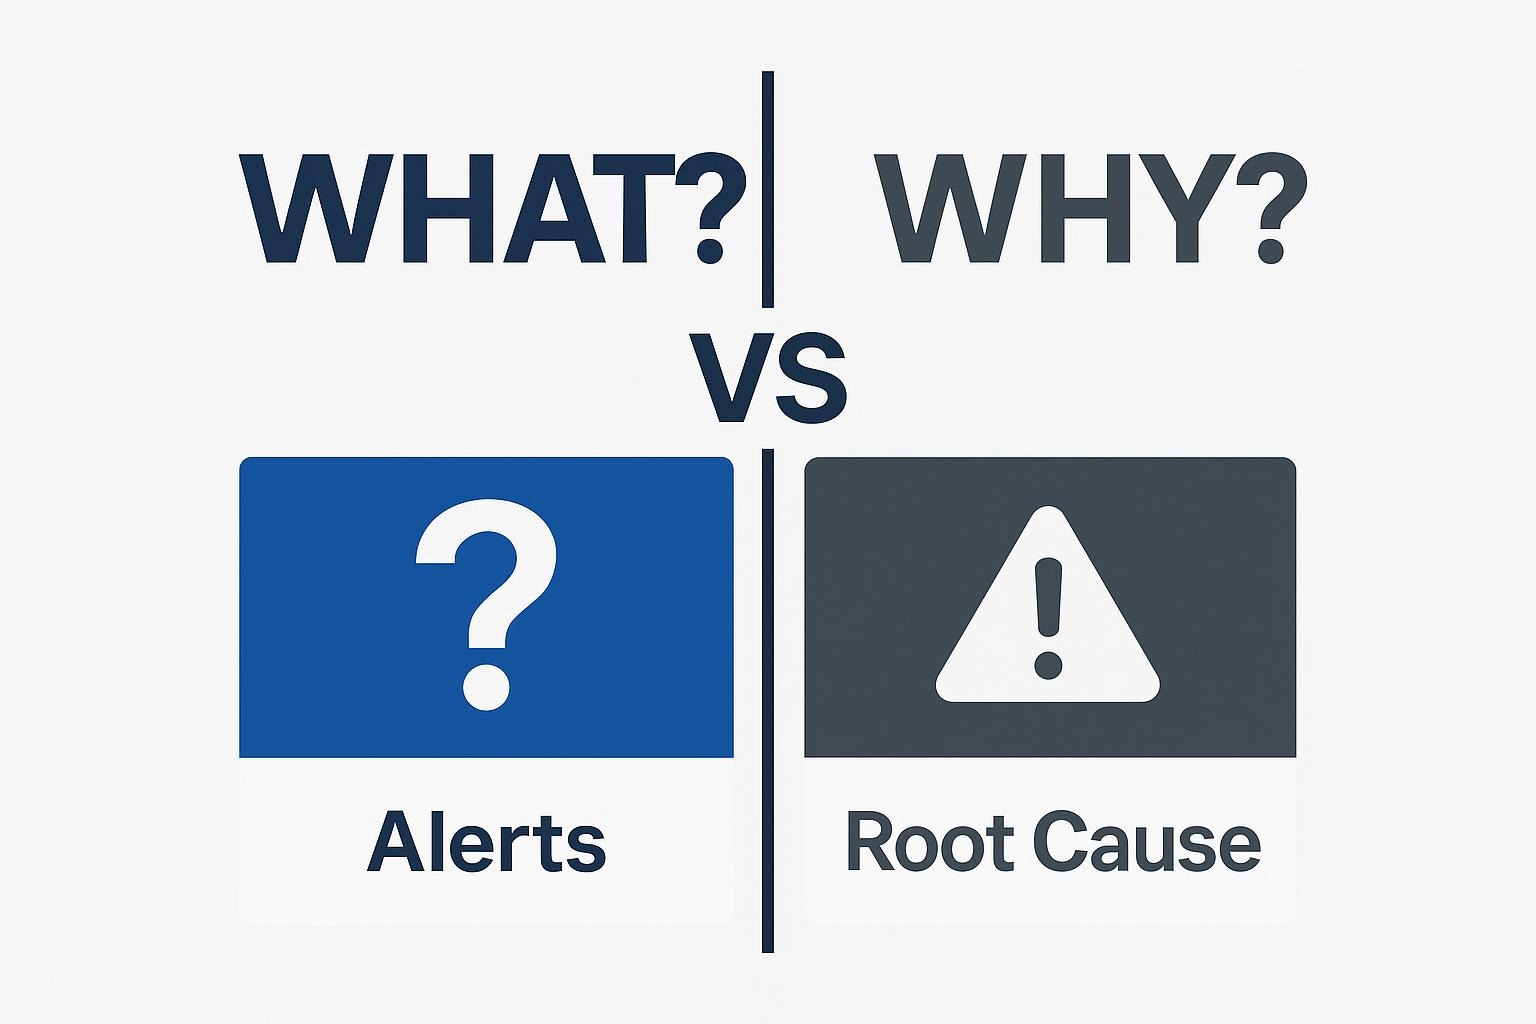
Monitoring tracks predefined metrics, such as uptime, error counts, and CPU usage. It answers "what happened" by firing alerts when thresholds are crossed. You define the rules, and the system watches for violations.
Observability goes deeper. By collecting metrics, events, logs, and traces, an observability platform lets you explore unexpected problems in real time. You can trace root causes rather than just detect symptoms.
Data teams need both capabilities. Monitoring catches known failure modes quickly, such as when a database connection drops or a sync job times out. Observability uncovers unknown problems, such as schema drifts, overnight volume surges, or rogue retry loops, that static rules may miss.
The operational difference matters too. A basic log scraper tells you a job died. A lineage-aware platform shows the Git commit that altered a column, the downstream dashboards now displaying stale data, and the revenue forecast they impact.
Regulations require audit trails and timely incident response. SOX, HIPAA, and GDPR mandate that you demonstrate data integrity and investigate incidents quickly.
How Do Legacy Platforms Handle Data Monitoring?
Legacy systems use batch log scrapers. Jobs copy log files to a central server, cron scripts parse them overnight, and you check multiple dashboards to understand what failed. This architecture worked for monolithic stacks but breaks when pipelines span cloud regions or ephemeral containers.
Real-Time Monitoring Failures
Legacy collectors process logs hours after events occur. Incidents surface only after customers report them, a lag that makes uptime SLAs impossible.
The tools weren't built for cloud-native environments. They fail when handling container churn because they expect static infrastructure. Serverless functions generate telemetry faster than batch collectors can process.
Fragmented Visibility and Alert Fatigue
Logs fragment across storage, compute, and orchestration layers. Root-cause analysis requires manually connecting dots across systems.
Without ML-driven anomaly detection, you rely on brittle thresholds that either miss failures or generate constant false positives. Teams mute alerts after triaging thousands of irrelevant notifications. This alert fatigue lets subtle data drifts slip through until they corrupt business dashboards.
Compliance and Cost Challenges
Compliance creates cost pressure:
- Proprietary log stores charge by volume, forcing you to delete records that regulators might demand later
- Coarse access controls mean anyone with console credentials can see sensitive data
- Least-privilege violations complicate privacy audits
Enterprises dedicate substantial engineering resources just to maintain these systems, writing custom parsers, rotating indexes, managing storage quotas. Each incident requires forensics across multiple consoles, extending mean-time-to-resolution significantly.
Scaling Limitations
Scaling amplifies every weakness:
- Telemetry volumes grow continuously
- License fees and storage bills increase while performance deteriorates
- Teams sample logs to stay under budget
- Blind spots appear during peak loads when visibility matters most
What Capabilities Do Modern Observability Platforms Provide?
Modern data observability platforms use a unified control plane architecture. A centralized system orchestrates distributed agents that run next to your data. You see every query, transform, and sync without copying data itself.
Unified Control Plane Architecture
This design eliminates dashboard sprawl. You get one place to watch pipelines, resources, and user activity in real time.
The control plane ingests streaming telemetry continuously. You get near-instant metrics on throughput, freshness, and error rates rather than waiting for batch log scrapes. Intelligent alerting filters noise so you focus on business-impacting issues instead of chasing minor fluctuations.
Automatic Lineage and Context
End-to-end context comes from automatic lineage and schema tracking. When a column changes upstream, downstream dashboards show the exact blast radius. You pivot from a failed job to the SQL statement and the developer responsible in seconds.
Machine Learning-Driven Detection
Machine learning handles anomaly detection instead of hard-coded thresholds. Algorithms learn normal behavior and flag subtle drifts in distribution, volume, or schema, capabilities that distinguish modern platforms from legacy quality systems.
Built-in Compliance and Cost Control
Compliance is built in through immutable, tamper-evident logs. Fine-grained RBAC limits who sees sensitive fields. Intelligent retention and tiered storage curb the runaway expenses typical of legacy log archives.
Cloud-Native Integration
Cloud-native integrations expose metrics to Prometheus, Datadog, or OpenTelemetry out of the box. Self-service dashboards let analysts ask "Why did yesterday's revenue dip?" and trace the answer to a delayed CDC stream without opening a terminal.
How Does Observability Impact Enterprise Operations?
Modern platforms surface anomalies and their root causes in real time. Teams spend minutes instead of hours hunting down failed transformations. Organizations using modern stacks report significant reductions in mean-time-to-resolution because metrics, logs, and lineage appear in one place.
Financial services groups have documented substantial reductions in audit-prep effort and hours lost to pipeline downtime after adopting automated lineage and anomaly detection. Eliminating manual rule maintenance (often requiring weeks of engineer time per quarter) allows you to redeploy talent toward new analytics instead of break-fix tasks.
Immutable, centrally stored logs satisfy retention mandates without excessive storage bills. Adaptive tiering keeps costs manageable while preserving the forensic trail regulators expect.
Fine-grained access controls prove who touched which dataset and when. You can satisfy audits without spreadsheet reconciliation.
Continuous data quality inspection means stakeholders trust the dashboards they use. Knowing the numbers are current, not hours old, becomes the foundation for faster decisions.
How Do Modern and Legacy Platforms Compare?
Legacy log-scraping stacks were built for batch processing. You wait for nightly jobs to finish, scrape gigabytes of text, and hope the right threshold fires an alert.
Modern platforms capture metrics, events, logs, and traces as they happen. They correlate telemetry automatically to give you answers instead of raw data.
Legacy tools index raw logs after the fact, forcing expensive reprocessing and manual correlation. Modern platforms stream lightweight metadata through a unified control plane, correlate it on ingest, and show lineage alongside quality signals.
How Does Airbyte Flex Provide Modern Observability?

Airbyte Flex uses hybrid deployment. Scheduling and UI run in Airbyte's cloud while every sync, transformation, and load happens inside your infrastructure. You keep the data plane behind your firewalls while maintaining a single place to watch jobs, inspect logs, and tune performance.
Key capabilities include:
- Structured metrics and logs that stream into Datadog or scrape with Prometheus when configured
- OpenTelemetry integration to surface failures, row counts, and latency in real time
- Early issue detection before problems affect business dashboards
- Audit-ready logs and encryption of data in transit and at rest with Enterprise edition configuration
- SOC 2, GDPR, and HIPAA compliance controls built in
The same open-source engine powers all deployments:
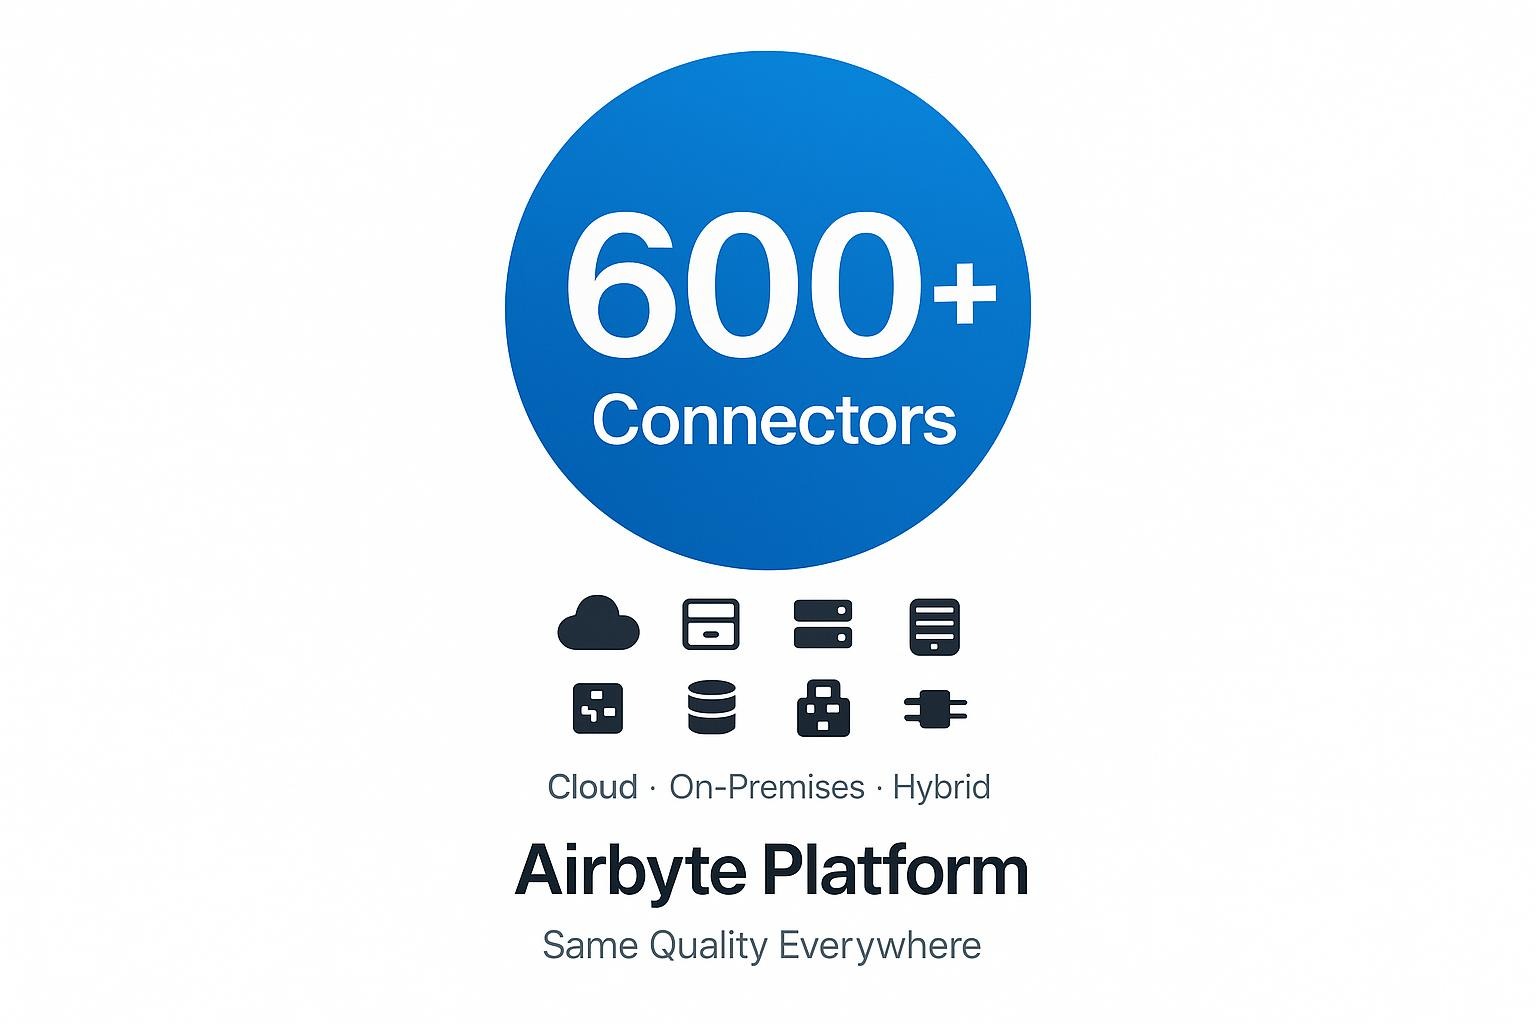
- Access to 600+ connectors across on-premises, cloud, or hybrid deployments
- Same Airbyte with same connector quality everywhere
- Complete library across all deployment models without feature trade-offs
- No split catalog between SaaS and self-hosted offerings like competitors
Teams adopting Airbyte Enterprise Flex move from proof of concept to production in weeks instead of months.
What Should You Evaluate When Choosing Platforms?
Choosing a data platform means focusing on business outcomes instead of feature checklists. Legacy stacks hide issues behind sampled logs or force expensive retention trade-offs. Teams scramble when incidents escalate or regulators demand proof of controls.
Modern systems surface context-rich traces in real time and retain them economically for as long as regulations require.
Prioritize these questions when evaluating platforms:
- Can you see root causes, not just that failures occurred? True observability requires correlation across metrics, logs, and traces to provide actionable insights instead of alerts.
- Does the platform provide verifiable audit logs by default? Compliance shouldn't require custom development or compromise data visibility.
- Will monitoring scale with your growth without cost explosions? Look for intelligent tiering and retention policies that grow with your business.
- Does the solution cover your entire landscape: cloud, on-premises, and hybrid, without blind spots? Partial visibility creates compliance and operational risks.
- Is it built on open standards that prevent vendor lock-in? Future-proof your investment with platforms that embrace OpenTelemetry and industry standards.
Run a high-value, high-risk pipeline as proof of value. A pilot anchored in open, standards-based telemetry reveals whether the platform delivers business outcomes.
What Does the Future of Data Observability Look Like?
The shift from reactive log scraping to proactive data intelligence represents a change in how enterprises operate. Legacy systems tell you pipelines broke after dashboards go dark. Modern observability shows why failures happened, which tables are affected, and how to fix issues before customers notice.
Machine learning layers pattern-based anomaly detection and predictive alerts on top of telemetry. Context-aware intelligence replaces static thresholds, scaling naturally with microservices and ephemeral resources.
Airbyte Flex delivers modern observability with customer-controlled data planes and compliance-ready audit logs. You get full visibility across hybrid deployments while maintaining SOC 2, GDPR, and HIPAA alignment. With 600+ connectors and no feature trade-offs, Flex scales observability to match your compliance needs. Talk to Sales to explore architecture options that fit your requirements.
Frequently Asked Questions
What makes observability different from traditional monitoring?
Monitoring tracks known metrics like uptime or error counts, while observability helps you explore unknown issues in real time. It correlates metrics, logs, and traces to show why something failed, not just that it failed.
Why do legacy monitoring tools struggle in hybrid environments?
Legacy tools depend on batch log scraping and static infrastructure. In hybrid setups with containers, serverless jobs, and regional pipelines, they miss events, delay alerts, and can’t correlate failures across systems.
How does observability improve compliance readiness?
Modern observability platforms create immutable, timestamped logs and lineage views. This provides clear audit trails for frameworks like SOX, HIPAA, and GDPR without manual reconciliation.
Why is Airbyte Flex a strong choice for observability?
Airbyte Flex separates the control and data planes so all sensitive activity stays in your environment. It streams structured logs, integrates with OpenTelemetry, and includes compliance controls for SOC 2, GDPR, and HIPAA.

.webp)
