Python Pandas DataFrame: Examples & Use Cases For ETL
Summarize this article with:
✨ AI Generated Summary
Python DataFrames, provided by the Pandas library, are versatile two-dimensional data structures ideal for organizing, manipulating, and analyzing structured data efficiently. They support creation from various data sources (lists, dictionaries, NumPy arrays, files like CSV, JSON, Excel, Parquet, XML) and offer powerful operations such as filtering, grouping, merging, sorting, and handling missing values.
- DataFrames simplify ETL workflows by enabling easy data extraction, transformation, and loading.
- PyAirbyte extends DataFrame capabilities with 600+ connectors for diverse data integration, supporting CDC and multi-vector database loading.
- Essential DataFrame methods include read/write functions, indexing (.loc, .iloc), aggregation, and data cleaning tools like fillna() and dropna().
A Python DataFrame, part of the Pandas library, is a powerful and flexible data structure that allows you to work with structured data. Whether you're handling small or large datasets, DataFrame Python enables you to efficiently organize, manipulate, and analyze your data. With its tabular design, you can manage data in rows and columns, simplifying tasks like filtering, transforming, and aggregating.
This article explores the full potential of Python DataFrames, helping you effectively use them for data integration, processing, and analysis tasks.
What Is a Python DataFrame and How Does It Work?
A Python DataFrame is a two-dimensional data structure with labeled axes (rows and columns). It is offered by the Pandas library, an open-source Python library that enables you to perform data manipulation and analysis.
Within a DataFrame, you can perform operations such as column addition and deletion, row addition and deletion, column renaming, and row slicing.
Let's look at a simple illustration of a DataFrame to understand its key components:

In this Pandas DataFrame:
- Column Label/Header: These are the names of the columns, such as Name, Age, Marks, Grade, and Hobby, in the DataFrame.
- Index/Row Label: Labels, such as S1, S2, S3, S4, and S5, are assigned to rows, helping identify each row in the DataFrame.
- Column Index: Refers to the position (0, 1, 2, 4, 5, …, N) of each column in the DataFrame.
- Row Index: Refers to the position (0, 1, 2, 4, 5, …, N) of each row.
- Row: Represents a single data record.
- Column: A collection of data points corresponding to a specific feature or attribute.
- Element/Value/Entry: A single data value located at the intersection of a row and column.
How Can You Create a DataFrame in Python Pandas?
Creating a DataFrame in Python Pandas is simple and can be accomplished through various methods. Let's start with generating an empty DataFrame and then explore different creation techniques.
Prerequisites for getting started include:
- Install the latest version of Python and Anaconda Navigator.
- Install Pandas using the pip install pandas command in the Anaconda prompt (Skip this if Pandas is already available).
Generating an empty DataFrame
- Open Jupyter Notebook in your browser or development environment.
- Create a new notebook by selecting File, then New, then Notebook, and choose the Python kernel.
- Import the Pandas library using the following code:
- Create an empty DataFrame with this simple command:
- You can now print the DataFrame df1 to the console:
After executing the above code, you will get the following output:

Creating DataFrames from Python Lists
A list in Python is an ordered collection of items, which can be of any data type. Lists are mutable and are indexed starting from 0. Let’s see an example of creating a DataFrame from a list:
Ouput:

You can also use a list of lists to create a DataFrame by passing it as data, with each inner list representing a row:
Output:

Building DataFrames from Dictionary Structures
A dictionary in Python is an unordered collection of key-value pairs. The keys are unique, and each key is associated with a value. To create a DataFrame from a dictionary of lists, the keys can serve as column labels, and the associated list becomes the column data:
Output:

Constructing a DataFrame from Pandas Series Objects
A Pandas Series is a one-dimensional array-like object that can hold various data types. You can add the series in a dictionary form to create a DataFrame as follows:
Output:

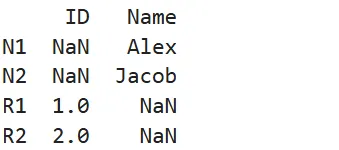
For more control over your DataFrame structure, you can customize row and column index labels:
Output:
Constructing a DataFrame from a Numpy Array
A Numpy array is an array object in Python used for numerical computations. You can create a DataFrame by passing a Numpy array along with column labels:
Output:

Creating DataFrames from Existing DataFrames
You can easily create a new DataFrame by filtering an existing DataFrame. This allows you to reuse the structure and data of another DataFrame.
Output:

How Can You Load Different Data Formats Into Python Pandas DataFrames?
Pandas provides simple and efficient functions to load data from multiple file formats directly into DataFrames. These functions handle the complexities of parsing different file structures and provide consistent DataFrame outputs.
Loading CSV Files into DataFrames
CSV is a widely used format that helps you store tabular data. You can load CSV files into a Pandas DataFrame using the read_csv() function.
Let’s create a simple example in Jupyter Notebook by considering a sample CSV file (demo.csv) that contains the following data:
Follow the steps below:
- Open Jupyter Notebook and click File > New > Text File.
- Save the above CSV data in the file as demo.csv.
- In your notebook, click File > New > Notebook and run the following code to load the CSV file into a DataFrame:
- To see the loaded data in DataFrame, use the following syntax:
Output:

Processing JSON Data Files
JSON is a popular format for data exchange and storing data in key-value pairs. You can load JSON data into a DataFrame using the read_json() function:
Let us consider a JSON file named demo.json:
Run the following Python code to load this JSON file into a DataFrame:
Output:

Working with Excel Files
Pandas also supports loading data from Excel files (.xls and .xlsx) using the read_excel() function. This function allows you to specify individual sheets within an Excel workbook to load into a DataFrame.
Let us take the example of loading an Excel file named employees.xlsx into Pandas DataFrame in Python using Jupyter Notebook. The file consists of two worksheets.
- First, upload the Excel file into the Jupyter Notebook. To do this, go to View > File Browser > Upload and browse your Excel file and click Open.
- Next, run the following Python code to load data from the specific sheet:
Output:

Loading Parquet Files
Parquet is a columnar storage file format that enables you to store large datasets efficiently. Pandas help you read Parquet files using the read_parquet() function.
To load a Parquet file userdata1.parquet into a DataFrame, you must upload it to the Jupyter Notebook using the same steps as in the previous section. Once you add the Parquet file to the directory, you can run the following code:
Let’s preview only the first two rows of the large parquet file using the head(2) function on the DataFrame.
Output:

Processing XML Data
XML (Extensible Markup Language) is commonly used to store and exchange data. Pandas allow you to read XML files using the read_xml() function.
Let’s first create the following XML file named demo.xml in Jupyter Notebook:
Now, run the following Python code to load the XML file into a DataFrame:
Output:

What Are the Essential Python Pandas Example Operations for DataFrame Manipulation?
DataFrame manipulation forms the core of data analysis workflows. These operations allow you to explore, clean, and transform your data to extract meaningful insights.
Viewing and Exploring Your Data
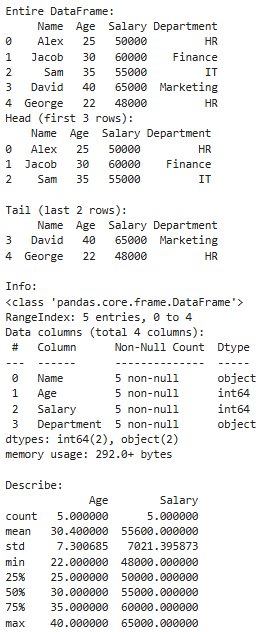
Understanding your data structure is the first step in any analysis. Pandas provides several methods to examine DataFrame contents and characteristics:
- print(): Prints the entire DataFrame.
- head(): Displays the first specified number of rows of the DataFrame. It defaults to 5 if not specified.
- tail(): Shows the last specified number of rows. It also defaults to 5 if not specified.
- info(): Provides concise information about the DataFrame, including number of entries, column names, data types, and non-null counts per column.
- describe(): Displays summary statistics such as mean, median, standard deviation, and percentile, count, max, and min for numerical columns.
Here is a simple example to understand how to view data in a DataFrame:
Output:
Selecting Specific Columns and Rows
You can access a column in a DataFrame using a bracket notation (df[‘columnname’]) or a dot notation (df.columnname).
Here’s an example of selecting a column from a DataFrame:
Output:

You can also select rows and columns in a DataFrame using two methods:
- Integer-Location Based Indexing (.iloc): Helps you select rows and columns by their index positions starting from 0.
- Label-Based Indexing (.loc): Allows you to select rows and columns based on their explicit labels or boolean conditions.
Update the above example by adding the following code for row selection:
Output:

Adding and Removing DataFrame Elements
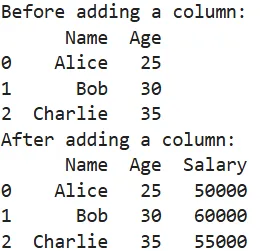
Dynamic data modification capabilities make DataFrames flexible for evolving analysis needs. You can add new columns using the following syntax:
Output:
To remove a column, you can use a drop() function with axis value 1 as follows:
Output:

You can add a row at the end of the DataFrame using loc[].
Output:

To drop a row from the DataFrame by index, you can utilize the drop() function with axis value 0.
Output:

Renaming Columns for Clarity
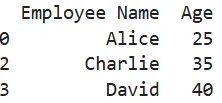
To rename columns in a DataFrame, use the rename() method. For the above example, run the following code:
Output:
Filtering Data Based on Conditions
To filter a DataFrame, use boolean indexing to retrieve the subsets of data according to the actual data values in the DataFrame. This method allows you to create filters using conditions applied to columns.
Run the following code to check the result:
Output:

The output filters only the information about David, whose age is greater than 35.
Grouping Data for Aggregation
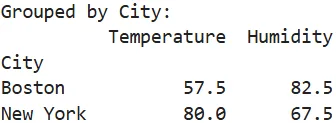
The groupby() function enables you to group data by one or more columns. You can then apply an aggregate function such as sum, mean, min, or max.
Here’s an example of grouping data in a DataFrame:
Output:
Combining DataFrames Through Merging
You can merge or join DataFrames using the merge() function. This works similarly to SQL JOIN operations. Here is an example to demonstrate how to merge two DataFrames:
Output:

Sorting Data for Analysis
To sort a DataFrame by one or more columns, you can apply the sortvalues() method. Let’s sort the above merged DataFrame (mergeddf) by ‘Age’ column in descending order:
In this program, you must set the ascending parameter to False to sort the data in descending order. If you specify True, the DataFrame will be sorted in ascending order.
Output:

Managing Missing Values Effectively
Pandas enable you to handle missing data in DataFrame using fillna() and dropna() functions. Here’s an example of a DataFrame with missing values:
Now, update the program to fill missing values with a default value utilizing the fillna() function:
You can also drop rows with missing values as follows:
Output:

In this output, you can see that the last two rows in the DataFrame have missing values. Initially, the missing values are handled by filling them in with default values, and then they are dropped.
Precise Data Location and Access
Indexing options such as .loc[] and .iloc[] help you locate specific data by label or position.
Example:
Output:

How Do DataFrames Support ETL Operations?
DataFrames are essential in ETL (Extract, Transform, Load) operations, providing an efficient way for data handling. Here’s how DataFrames are useful in each ETL phase:
Extract
Pandas DataFrames facilitate the extraction of large datasets from various sources such as text files, CSV, Excel sheets, JSON, SQL databases, and APIs. With functions like readcsv(), readsql(), or read_json(), you can load data into a DataFrame, simplifying the extraction step.
Transform
You can apply numerous transformations, such as filtering, grouping, aggregating, and reshaping data, using Python DataFrames. They also help you handle missing values, convert data types, and perform complex string manipulations.
Some functions, such as drop_duplicates() and fillna(), and techniques like boolean indexing allow you to transform data for analysis or additional processing.
Load
After transforming the data, DataFrames make it easy to load the cleaned data into various formats, including databases, CSV files, or Parquet files. DataFrames support methods like tosql(), tocsv(), or to_parquet() to support the ingestion of processed data into the appropriate storage or analysis platforms.
How Can You Extend Python DataFrames with Airbyte for Enhanced Data Integration?
While Python DataFrames are powerful for data manipulation and analysis, their connectivity to diverse data sources can be limited. Airbyte provides the open-source PyAirbyte library to bridge this gap and create more comprehensive data integration workflows.

With PyAirbyte, you can extend the capability of DataFrames by extracting data from hundreds of sources using Airbyte connectors. Following this, the data is loaded into various SQL caches, including Snowflake, BigQuery, DuckDB, or PostgreSQL. You can then convert the data from these caches into a Pandas DataFrame. This enables you to manipulate and analyze the data within a Python environment efficiently.
For detailed insights, you can refer to the PyAirbyte demo. Apart from PyAirbyte, Airbyte offers several other features as follows:
- Extensive Connector Catalog: Airbyte provides 600+ pre-built connectors to help you transfer data between various platforms and destinations.
- Custom Connector Development: Using Airbyte’s AI Assistant no-code Connector Builder, you can create custom connectors as per your requirements. The AI assistant prefills the configuration fields, speeding up the process.
- Change Data Capture (CDC): Airbyte supports CDC, which enables you to track source data changes and replicate them to the destination system. This ensures data consistency across platforms.
- Multi-Vector Database Support: You can load all your unstructured data directly into Airbyte-supported vector databases, including Pinecone, Milvus, Weaviate, or Qdrant.
Conclusion
In this comprehensive guide, you have learned how Python DataFrames can help you manage datasets within an easy-to-use tabular format. DataFrames are also beneficial in simplifying ETL operations. You can extend the power of DataFrames using Airbyte’s PyAirbyte for enhanced ETL workflows.
Frequently Asked Questions
1. What is the difference between a DataFrame and a regular Python list?
A DataFrame is a two-dimensional labeled data structure that can hold different data types in columns, while a Python list is a one-dimensional collection of items. DataFrames provide built-in methods for data analysis, filtering, and manipulation that are not available with regular lists, making them much more suitable for data analysis tasks.
2. How do I handle missing values in a DataFrame?
Identify missing values with `isnull()`. Use `fillna()` to replace them with specific values, or `dropna()` to remove rows or columns containing them. Choose the method based on data context and analysis requirements for accurate results.
3. Can I convert a DataFrame back to other data formats?
Yes, DataFrames offer multiple export methods, including tocsv() for CSV files, tojson() for JSON format, toexcel() for Excel files, tosql() for database tables, and to_parquet() for Parquet format. These methods offer flexibility in sharing and storing your processed data in various formats, making them suitable for different applications.
4. What are the performance considerations when working with large DataFrames?
When handling large DataFrames, optimize memory with appropriate data types, use vectorized operations over loops, process data in chunks, and consider tools like Dask. Efficient file formats like Parquet also improve loading and processing performance.
5. How does PyAirbyte enhance DataFrame functionality?
PyAirbyte extends DataFrame capabilities by providing access to 600+ pre-built connectors for extracting data from diverse sources, including databases, APIs, and SaaS platforms. It enables you to materialize data directly as DataFrames while supporting advanced features like Change Data Capture (CDC) and integration with modern data warehouses and vector databases.

.webp)
