Unified Logging and Lineage Across Hybrid Deployments
Learn how unified logging and lineage across hybrid deployments speeds up troubleshooting and provides audit-ready pipeline evidence.
Hybrid deployments need one logical logging and lineage layer that preserves causality while keeping raw evidence within approved regions. Unified logging aggregates every control-plane event and data-plane action into a common schema; lineage tracks each dataset from source to destination. Team communication can be centralised too with Slack to PostgreSQL. Hybrid architectures scatter logs and lineage metadata across public clouds, private VPCs, and on-premises servers.
Without a single view, you chase errors through multiple dashboards, struggle to prove controls during audits, and miss signals buried in disconnected storage. Gigamon’s 2025 survey of 1,021 security and IT leaders found that 48% lack complete visibility across hybrid cloud infrastructure. Shared identifiers should connect those regional records without requiring universal raw-log centralization, which can create compliance exposure.
TL;DR
- Unified Logging and Lineage Across Hybrid Deployments creates one logical visibility layer without requiring every raw event to cross regional boundaries.
- Use shared timestamps, job IDs, run IDs, and correlation IDs to preserve causality across control and data planes.
- Combine indexed detection, economical object storage, and federated regional search according to latency, cost, and sovereignty requirements.
- Pair write-once storage with cryptographic integrity checks, controlled retention, and protected access logs.
Why Does Unified Logging Matter in Hybrid Deployments?
Unified logging reduces manual correlation during outages by connecting cloud control-plane orchestration events with execution details from in-boundary data planes. Without that shared view, each domain stores logs in its own format and dashboard, forcing you to stitch together context during every outage.
When a CDC pipeline stalls or an ETL processing step corrupts a dataset, scattered logs force you to hop between tools instead of following a single thread. That delay costs business hours and risks missing service-level objectives.
Auditors reviewing SOC 2 controls or HIPAA audit controls may require evidence relevant to the organization’s scoped controls. That evidence can include access, processing, and data-transfer records.
With DORA in active enforcement, DORA logging obligations may also apply to an organization’s scoped controls. Incomplete logs can create compliance exposure and audit findings.
Lineage turns raw log events into a narrative showing how data moved, changed, and landed. Without unified logging, lineage graphs break at cloud boundaries. These breaks prevent you from proving data custody or tracing an error's blast radius. Consolidating logs and lineage into one layer speeds troubleshooting and makes audit evidence and custody records more complete.
The resulting requirement is a region-aware architecture that connects evidence across environments without indiscriminate replication.
What Makes Logging and Lineage Challenging in Hybrid Architectures?
A hybrid stack includes a cloud-based control plane that orchestrates operations and an in-boundary data plane that executes the work. Each environment generates its own logs, uses different schemas, and often stores them in different regions. This broken correlation limits visibility and prevents you from tracing events across the full path.
Telemetry pipelines may export logs and metadata to provider regions outside your legal boundary. That transfer might be convenient for dashboards, but it can expose personal data. It may also constitute a regulated international transfer when no valid legal basis, safeguard, or approved regional route exists. Meanwhile, on-premises log stores rarely capture SaaS orchestration events, so auditors see only half the picture.
Technical hurdles compound the governance risk:
- Logs arrive late because cross-cloud links add latency
- Fields rarely line up because vendors use different log formats
- Job identifiers collide when multiple schedulers reuse numeric IDs
Consider a hypothetical scenario where a global bank cannot prove how a failed CDC job in its European data center related to a retry triggered from a U.S. SaaS control plane. Missing lineage links create audit exposure when retries cross control-plane and data-plane boundaries.
What Should Unified Logging and Lineage Look Like?
You need one logical visibility layer spanning control-plane API calls and data-plane record writes while raw events remain in their approved regions. The design depends on detection latency, Wide Area Network (WAN) performance, and the number of simultaneous queries. It also depends on sovereignty rules, retention cost, and the level of evidence an investigation requires.
A practical architecture uses an indexed hot path for continuous detection with tight latency objectives. Object storage in Parquet or Iceberg provides economical retention and supports historical investigation. Federated in-region search applies when raw logs cannot cross jurisdictions. Transfer law may prevent replication, WAN latency may make remote ingestion unreliable, and indexing every retained event may be prohibitively expensive. These constraints make universal centralization incomplete advice.
Use the following ownership model to align each telemetry layer with its retention policy and operational purpose.
What Are the Best Practices for Building Unified Logging and Lineage?
Start by normalizing identifiers and event formats, then preserve regional boundaries as you automate collection and routing. Complete the design with explicit controls for retention, access, integrity, and lineage completeness.
1. Start With a Central Schema and Global Identifiers
Define a shared event schema, then serialize records as JSON or store them in Parquet. Your schema needs:
- Timestamp in ISO-8601 UTC format
- pipeline_id with job_id and run_id for tracking
- source_id and destination_id for flow mapping
- user_id and service_account for access control
- correlation_id for cross-system joins
Cross-plane correlation IDs tie control events, such as a scheduler triggering a sync, to data-plane execution, affected streams and datasets, and execution metrics. Synchronize clocks to a documented reliable time source so timestamp ordering remains defensible across regions.
2. Separate Control and Data Plane Logs by Function
Keep orchestration and execution records in distinct streams so each can support its operational purpose without breaking cross-plane correlation.
3. Keep Sensitive Logs Within Your Boundary When Required
Keep raw PHI, payment data, or customer identifiers in-region when a transfer assessment prohibits export. Apply the same rule when policies, contractual commitments, or residency requirements prohibit export. Where your transfer assessment permits export, document the legal grounds, processor access, minimization, encryption, and access controls. Move logs only through approved regional routes that meet those requirements.
Under strict sovereignty conditions, store those logs in the same jurisdiction as the data they describe, then ship summaries (counts, hashes, error codes) to your cloud SIEM. This approach reduces compliance exposure in hybrid deployments and demonstrates that no raw records crossed borders. Treat stable hashes as pseudonymous because a controller that retains the original values or mapping may still identify individuals.
4. Automate Log Collection and Retention Policies
Manual SCP copies and ad-hoc S3 buckets collapse the first time volume spikes. Deploy Fluent Bit or equivalent collectors next to every workload and let them funnel logs into region-aware pipelines. Base retention and cold-storage transitions on applicable regulations.
5. Integrate Lineage Tracking Into ETL and CDC Jobs
Emit lineage metadata at every step by capturing source versions, processing-logic hashes, and destination checksums directly inside your jobs. Use the same run and dataset identifiers throughout the job so lineage consumers can connect each processing event.
6. Stream Unified Logs to a Central Observability Layer
After collectors structure and sanitize records, route control- and data-plane logs through a durable bus, such as Kafka, when the pipeline needs durable buffering. Use OpenTelemetry collectors for collection and processing, then send the resulting telemetry to your existing SIEM or a regional store. Normalization at ingest time removes region-specific format differences, and back-pressure handling manages traffic spikes.
7. Align Retention and Access With Compliance Frameworks
Distinguish documentation-retention requirements from audit-log policy decisions.
Map each log category to its governing standard and automate deletion once the applicable timer expires. Enforce RBAC on every viewer and API key, and record those access events in their own immutable log stream.
How Can Unified Logging Strengthen Compliance and Security?
Centralized or federated logs can provide one logically connected record of control-plane commands and data-plane events. Aggregation provides connectivity, while retention controls provide tamper resistance and cryptographic integrity mechanisms provide tamper detection.
WORM storage prevents modification or deletion under a defined policy. For example, no user can override S3 Object Lock compliance mode, while governance mode permits authorized users with bypass privileges to alter retention. Legal holds are separate from timed retention and can continue indefinitely, so they require an explicit release process to prevent unbounded storage costs.
Cryptographic hashing serves a different purpose. Hash chains or signed digests reveal whether someone changed or removed records after collection. CloudTrail log-file validation, for example, uses SHA-256 hashes and RSA-signed digest files. Validation detects changes or removals, while WORM storage prevents deletion. Pair integrity verification with WORM storage. Restrict retention-policy administration to a separate role. Record every read, export, legal hold, and policy change in another protected stream.
Key compliance benefits include:
- Immutable audit trails through write-once storage with defined governance or compliance modes
- Tamper detection through hash chains, signed digests, or cryptographic verification
- Cross-environment breach reconstruction by correlating control and data events
- Automated compliance reporting for SOC 2 Type II, GDPR, or DORA reviews
- Regional data sovereignty by keeping PHI or PII within legal boundaries
For a healthcare deployment, apply this pattern to PHI-bearing data-plane logs and redacted control-plane summaries. The design still requires access controls over the regional store, documented retention, and an assessment of whether pseudonymous identifiers or remote support access constitute a regulated transfer.
How Does Unified Lineage Improve Data Reliability?
Complete lineage maps every dataset from source system to dashboard, so errors surface where they occur. When each sync, processing step, and load carries consistent identifiers, you can trace a broken report back to the single job or column that introduced bad data, even across on-premises databases and multiple clouds.
Key reliability improvements include:
- Rapid root cause identification by tracing datasets from dashboard to source
- Blast radius visualization showing which tables, jobs, and dashboards depend on changing schemas
- Deterministic error tracking replacing manual log correlation with directed search
- Proactive impact analysis before deploying schema changes or infrastructure updates
How Can You Track Lineage Across Every Run?
For complete lineage, instrument each finite ETL or CDC attempt with OpenLineage run events. Emit a START event and a terminal COMPLETE, ABORT, or FAIL event. Each run receives a unique runId. Do not reuse the failed attempt's runId for a retry. Close the failed attempt with ABORT or FAIL, then create a new runId. Use a parent-run facet to preserve the relationship between the scheduled job, failed attempt, and retry. Dataset-version facets can distinguish CDC checkpoints or Iceberg snapshots that share the same logical dataset name.
The following RunEvent shows the identifiers and column-level relationship a lineage consumer can use. This example records a START event with its run, job, input, output, and column-lineage metadata.
<pre><code>{
"eventType": "START",
"eventTime": "2025-10-24T22:42:42.000Z",
"run": {"runId": "d46e465b-d358-4d32-83d4-df660ff614dd"},
"job": {"namespace": "food_delivery", "name": "example_job"},
"producer": "https://github.com/OpenLineage/OpenLineage/blob/v1-0-0/client",
"schemaURL": "https://openlineage.io/spec/2-0-2/OpenLineage.json",
"inputs": [
{"namespace": "food_delivery", "name": "public.delivery_7_days"}
],
"outputs": [
{
"namespace": "food_delivery",
"name": "public.top_delivery_times",
"facets": {
"columnLineage": {
"_producer": "https://some.producer.com/version/1.0",
"_schemaURL": "https://openlineage.io/spec/facets/1-2-0/ColumnLineageDatasetFacet.json",
"fields": {
"order_id": {
"inputFields": [
{
"namespace": "food_delivery",
"name": "public.delivery_7_days",
"field": "order_id"
}
]
}
}
}
}
}
]
}</code></pre>Consider a hypothetical fintech scenario where suspicious revenue numbers appear in Looker. Detailed lineage would let engineers move from the dashboard to the failed dbt model, then inspect the specific run and input version through a direct causal path.
How Can You Implement Unified Logging with Existing Tools?
Treat your cloud logs as data streams that flow through controlled regional collection points. Use an OpenTelemetry Collector as a central pipeline to receive telemetry. Then route approved records to AWS CloudWatch, Azure Monitor, or your existing ELK or Splunk infrastructure, either on-premises or in a compliant region. The collector normalizes log formats before they reach your analysts. This removes cross-vendor inconsistencies.
1. Configure Data Plane Log Streaming
Using TLS encryption, direct connector throughput and latency logs from your hosts to your SIEM endpoint. Preserve job, run, and correlation identifiers so the destination can connect these records to control-plane events.
2. Set Up Control Plane Event Streaming
Route orchestration events through Kafka or OpenTelemetry for distribution to multiple consumers. Apply redaction before regional routing, and keep the memory limiter first in the processing pipeline so downstream back-pressure does not exhaust the collector.
3. Implement Global Correlation IDs
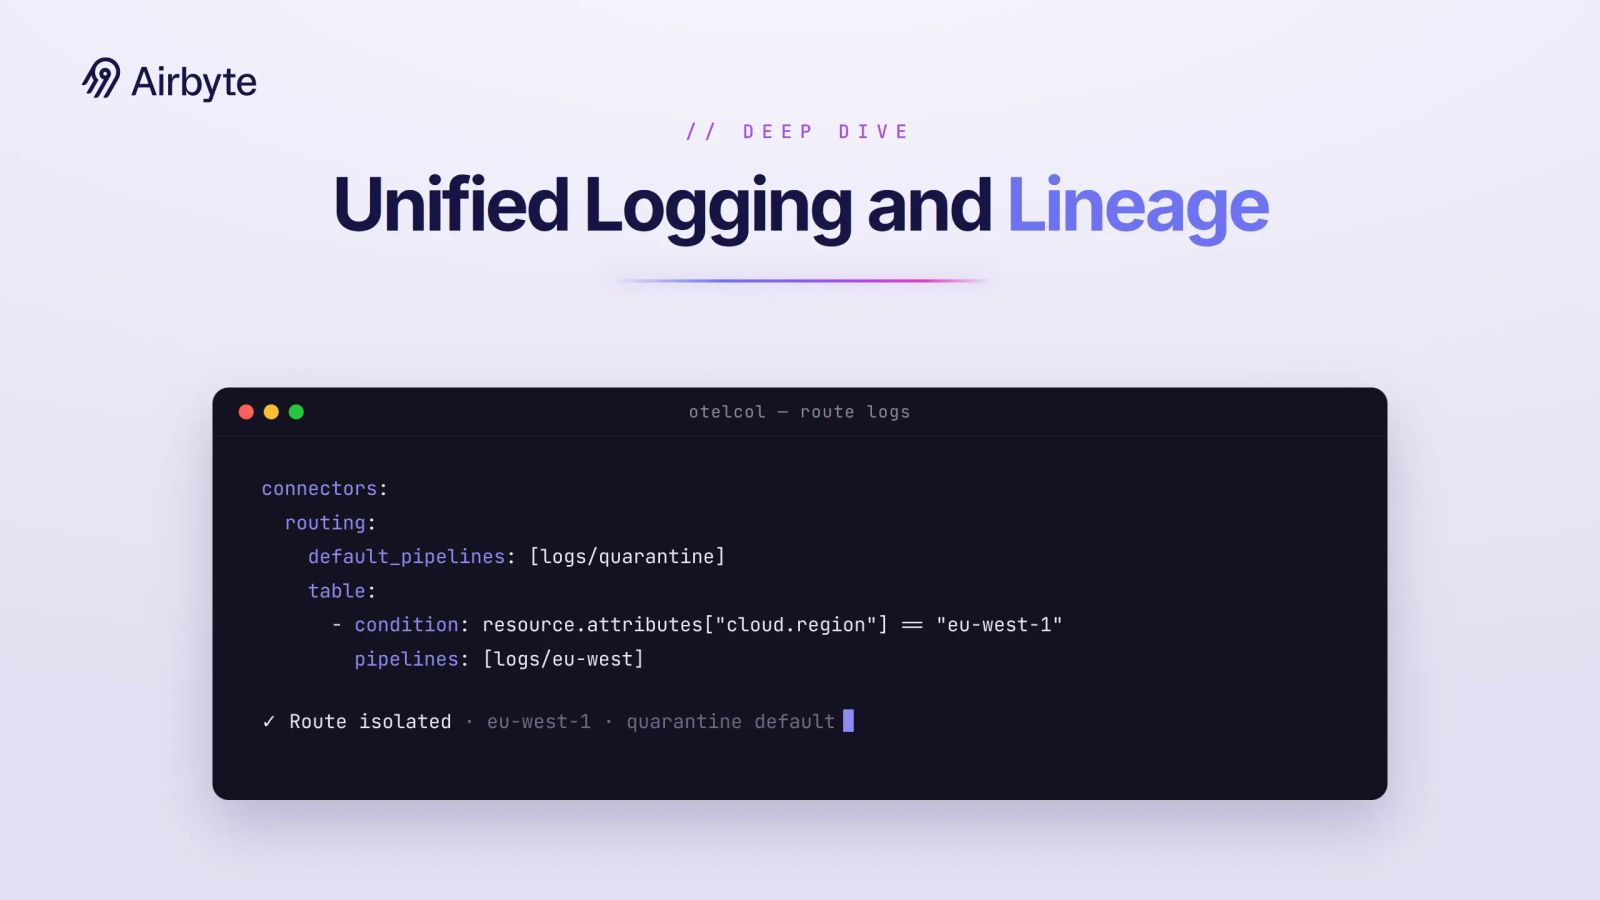
This example uses persisted filelog checkpoints, collector-side redaction, memory limiting, and the current routing connector. It also uses CloudWatch SigV4 authentication, required CloudWatch log-group and log-stream headers, and disk-backed exporter queues. Durable collector-local storage provides quarantine. Replace the example endpoints and region values with your approved regional destinations. The default route must resolve to a collector-local, approved quarantine destination. The collector must not export records with an absent or unrecognized region attribute across a jurisdictional boundary.
<pre><code>extensions:
file_storage/checkpoints:
directory: /var/lib/otelcol/file_storage
timeout: 1s
fsync: true
sigv4auth/logs:
region: us-east-1
service: logs
receivers:
filelog:
include: [/var/log/app/*.log]
start_at: beginning
storage: file_storage/checkpoints
processors:
memory_limiter:
check_interval: 1s
limit_mib: 1500
spike_limit_mib: 300
redaction:
allow_all_keys: false
allowed_keys: [cloud.region, job_id, run_id, correlation_id, severity]
blocked_values:
- "4[0-9]{12}(?:[0-9]{3})?"
- "(5[1-5][0-9]{14})"
hash_function: sha256
summary: info
connectors:
routing:
default_pipelines: [logs/quarantine]
error_mode: ignore
table:
- condition: resource.attributes["cloud.region"] == "us-east-1"
pipelines: [logs/us-east]
- condition: resource.attributes["cloud.region"] == "eu-west-1"
pipelines: [logs/eu-west]
exporters:
otlphttp/us-east:
endpoint: https://logs.us-east-1.amazonaws.com/v1/logs
headers:
x-aws-log-group: MyApplicationLogs
x-aws-log-stream: default
auth:
authenticator: sigv4auth/logs
sending_queue:
storage: file_storage/checkpoints
queue_size: 1000
num_consumers: 10
block_on_overflow: true
retry_on_failure:
initial_interval: 5s
max_interval: 30s
max_elapsed_time: 300s
otlphttp/eu-west:
endpoint: https://eu.example.com/v1/logs
sending_queue:
storage: file_storage/checkpoints
queue_size: 1000
block_on_overflow: true
retry_on_failure:
initial_interval: 5s
max_interval: 30s
max_elapsed_time: 300s
file/quarantine:
path: /var/lib/otelcol/quarantine/quarantine.json
service:
extensions: [file_storage/checkpoints, sigv4auth/logs]
pipelines:
logs/ingest:
receivers: [filelog]
processors: [memory_limiter, redaction]
exporters: [routing]
logs/us-east:
receivers: [routing]
exporters: [otlphttp/us-east]
logs/eu-west:
receivers: [routing]
exporters: [otlphttp/eu-west]
logs/quarantine:
receivers: [routing]
exporters: [file/quarantine]</code></pre>The persistent sending queue absorbs temporary destination outages. block_on_overflow: true applies back-pressure instead of immediately discarding new batches when the queue fills. retry_on_failure controls how long the exporter retries. Persisted offsets and disk-backed queues reduce loss and unnecessary replay, but at-least-once delivery can still produce duplicates, so consumers should be idempotent. Monitor queue size, failed-send counters, and processor-refused records. Disk exhaustion, a prolonged destination outage, or an undersized collector can still interrupt delivery.
Why Is Unified Logging the Foundation of Hybrid Observability?
Hybrid observability depends on preserving causality across records and stores. Without reliable clocks, correlation, and retention, incident timelines become misordered, and security investigations become incomplete. Consolidated or federated search can reconstruct a single causal sequence in which CDC lag in your manufacturing plant correlates with the schema change deployed from your cloud control plane. You can link failed pipeline runs directly to the connector version that caused them, even when separate sovereign stores retain the raw records. Then verify that causal sequence through production acceptance tests.
How Does Unified Logging Provide Complete Hybrid Visibility?
Validate complete visibility with acceptance tests before moving the architecture into production:
- Route isolation: Inject tagged records for every recognized region plus an absent or unrecognized region. Confirm that recognized records reach only their approved destination. Verify that all other records stay in the collector-local quarantine route.
- Recovery-point validation: Interrupt each destination long enough to exercise the persistent sending queue. Restore service, then verify that collection resumes from stored offsets. Measure any loss or replay, and confirm that idempotent consumers handle duplicate records correctly.
- Clock-drift alarms: Compare control-plane and data-plane timestamps with the documented reference time source. Alert when drift exceeds your approved threshold. Verify that the resulting event appears in the protected audit stream.
- Lineage completeness: For each finite ETL or CDC attempt, confirm that one
STARTevent and one terminalCOMPLETE,ABORT, orFAILevent share the expected runId. Verify that retries use new runIds and retain their parent-run relationship. - Sovereign-query access: Query each regional store through an approved role. Confirm that unauthorized roles cannot read or export raw records, and verify that a protected log stream captures every read and export attempt.
Record the result of each test with the collector version, routing policy, region, run ID, and timestamp. Repeat the suite after routing changes, retention-policy changes, collector upgrades, or adding a jurisdiction so complete visibility remains a verified property rather than an architectural assumption.
How Airbyte Flex Helps Unify Logging and Lineage in a Hybrid Deployment
Airbyte Flex uses a hybrid deployment architecture that keeps data-plane execution in the customer-controlled environment. The hybrid control plane remains in the cloud while data, credentials, keys, and data-plane logs stay in-boundary.
Airbyte Flex provides audit logs and lineage metadata for this deployment model. Your observability pipeline can route its job and connection metadata into your existing stack while raw records remain in approved sovereign stores.
For healthcare deployments, Airbyte Flex uses an architecture designed to keep ePHI in your VPC. Teams can apply the same routing, retention, access-control, and lineage patterns to clinical data pipelines without requiring universal raw-log replication.
Where Should You Start?
Start by validating regional routing, retention, access logging, and lineage completeness in one representative pipeline. Get a demo to see how Airbyte Flex keeps data-plane execution in your environment while its cloud control plane orchestrates operations.
Frequently Asked Questions
What Is the Difference Between Unified Logging and Lineage Across Hybrid Deployments and Traditional Logging?
Traditional logging scatters events across multiple systems, each with its own format and storage location. Unified logging aggregates or logically connects control-plane and data-plane events through a shared schema and consistent identifiers. You can then trace activities across the full path in hybrid environments without manual correlation.
How Does Unified Lineage Help With Compliance Audits?
Unified lineage creates a traceable record showing how data moved from source to destination, including captured processing logic. Auditors can use that record to verify data custody, support evidence of residency compliance, and trace any dataset back to its origin for SOC 2, HIPAA, and DORA reviews.
Can You Implement Unified Logging Without Moving Sensitive Data to the Cloud?
Yes. Keep raw records in approved regional stores and provide investigators with an approved federated query path when they need access. Summaries can provide centralized visibility without exporting the raw records.
What Tools Integrate With Unified Logging Architectures?
Most observability stacks work with unified logging through standard protocols. OpenTelemetry collectors, Fluent Bit collectors, Kafka streams, and SIEM platforms (Splunk, ELK, Datadog) all consume structured JSON logs.

Integrate with 700+ apps using Airbyte
Move data from 700+ sources into warehouses, lakes, and beyond. Set up pipelines in minutes with pre-built connectors and the Connector Builder.