Learn how to detect data quality issues on your Airbyte syncs with re_data.
Published on Jun 17, 2022
Summarize this article with:


Have you ever been in a situation where you’ve been using a data model for months only to find out that the quality of the data was compromised? Unfortunately, this tends to be a fairly common problem in the modern data stack world. It can be easy to let data quality issues go undetected for weeks if you don’t have proper data monitoring and data quality checks in place. You want to ensure your data is always reliable and doesn’t need to be questioned by the people using it to create insights. Just one data quality issue can build doubt in your data.
Luckily, there are many solutions coming to market to test and monitor ingested data and data models. One of those is re_data, an open-source dbt package that focuses on data reliability. The re_data package allows you to calculate and monitor various metrics about your dbt models such as row count, freshness, and schema changes. You can even set up alerts through Slack depending on different thresholds of these metrics.
I love using open-source packages together because it adds a lot of customizability. re_data is great to use with data ingestion tools like Airbyte to ensure your data is properly ingesting and looks as expected. Because there is no built-in alerting feature with Airbyte, it helps you to monitor that the connectors are loading the right volume of data, ingesting data on the schedule you specified, and correctly normalizing tables. It even includes dbt macros to clean, filter, and validate your data as it is ingested.
Let’s walk through how to set up an Airbyte connector and use re_data in combination with dbt to ensure we are ingesting the highest quality data. We will calculate basic table-level metrics such as row count and freshness. We will also look at nulls on a column level. Lastly, we will set up macros to clean our data and validate it based on certain criteria.
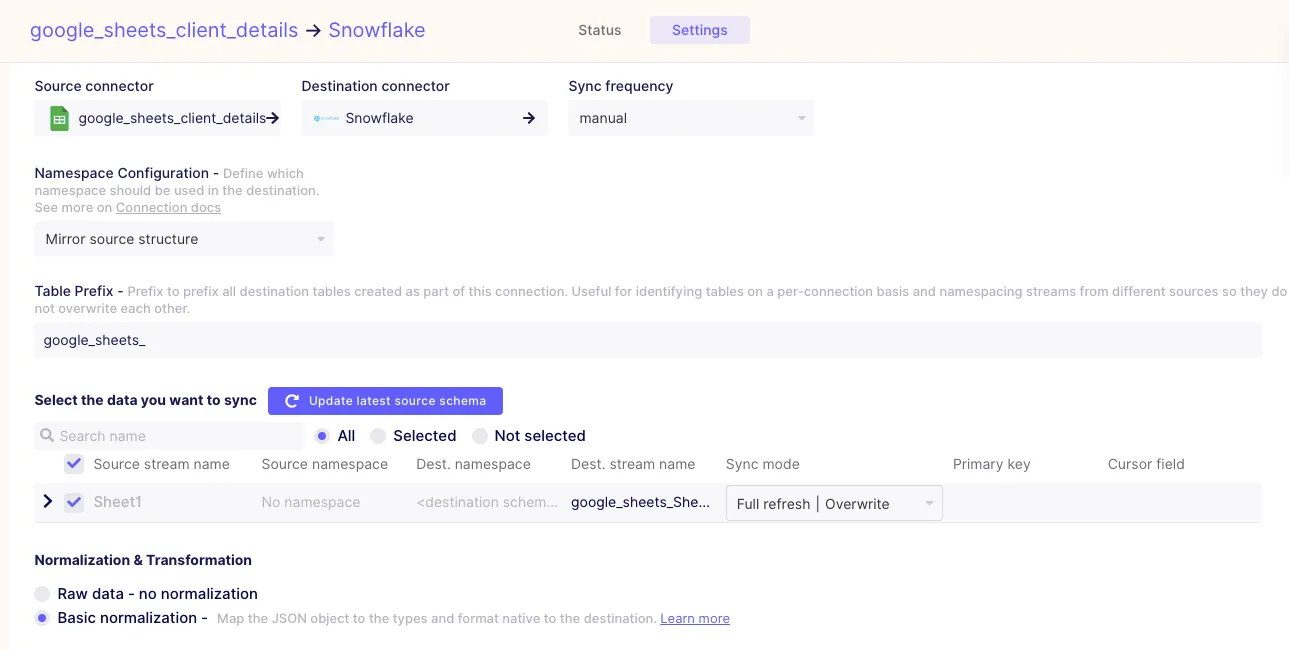
In this tutorial, we are going to be using a Google Sheet connector set up with Airbyte. Google sheets tend to be prone to human error when entering data, so they are a great place to start when putting data quality checks in place. We will be using an <span class="text-style-code-dark">inventory_levels</span> spreadsheet for the purpose of this tutorial. To learn more about setting up a Google Sheet connector with Airbyte, check out this documentation.

After you have your connector set up, it is important to create a base model in your dbt project. If you’re familiar with dbt, then you know that this is essentially just a copy of your raw data but with basic castings such as column names or data types. With creating base models in dbt, it is imperative that you properly set up your src.yml files. This will also be important when using re_data. If you aren’t familiar with the set-up of these models, feel free to read more about that in this article.
Now that we have our Airbyte connector and dbt base model properly set up, let’s start integrating them with re_data. First, you need to add the latest package version to your packages.yml file. Then, you simply install by running the <span class="text-style-code-dark">dbt deps</span> command. Yes, it really is that easy! Because Airbyte integrates with dbt, you can as well run your dbt models and re_data data quality checks all within Airbyte after your syncs complete.
You have a few different options for how you want to use re_data. You could choose a global configuration or you could choose to configure the monitoring on a model level. Personally, I find it easiest to mix the two. Chances are that you are going to want to monitor your tables with the same metrics. By defining the universal metrics in the global config, you don’t have to repeat code. But, when doing this at the model-level, you still have the option to add new metrics and override global ones.
This being said, let’s set up the global configuration!
First, you want to navigate to your dbt_project.yml file. Here you will be defining variables to be used by re_data. You can create a <span class="text-style-code-dark">var</span> block and add a few other blocks beneath it. Keep in mind that these are all optional.
The first two variables refer to the time window in which you want your metrics to run. Typically, without these variables, they run daily. This means that you will only be alerted of an abnormality the day it happens. When you set this window for a week, which is what I did, you will get that alert every day for that week’s window.
vars:
  # (optional) if not passed, stats for last day will be computed
  re_data:time_window_start: '{{ (run_started_at - modules.datetime.timedelta(1)).strftime("%Y-%m-%d 00:00:00") }}'
  re_data:time_window_end: '{{ run_started_at.strftime("%Y-%m-%d 00:00:00") }}'
Personally, I like having it set up with the week-long time window in case I forget to check on an error. It holds me accountable and keeps me aware of the data issues until they are fixed. You could also make this window longer than a week or just a few days long by changing the Python date format code.
Next, we want to define the metrics we want to calculate on the table and column level. These will all be defined under a <span class="text-style-code-dark">re_data:metrics_base</span> block in your dbt_project.yml file.
On the table level we definitely want to calculate row_count and freshness. Row_count will alert us if we have an abnormally low or high number of rows being ingested based on a calculated median, mean, and z-score. Data freshness of dbt models will tell us the last time our table has ingested new data. In the case of Google Sheets, freshness is particularly helpful because it will alert you when the sheet has last been updated. If it’s supposed to be updated daily, but hasn’t been updated in 3 days, you will be alerted of that.
re_data:metrics_base:
    table:
      - row_count
      - freshness
Let’s look at some column-level metrics now. In our case, we care the most about null values, so we will be adding a metric called <span class="text-style-code-dark">nulls_count</span> under our <span class="text-style-code-dark">column</span> and <span class="text-style-code-dark">numeric</span> block. You can also include other numeric metrics such as variance, min/max, avg, and stddev. re_data also offers text metrics like string length and missing_count.
column:
      numeric:
        - nulls_count
re_data also offers more optional variables which you can learn about here. One that is really cool is the option to add owners to different datasets. By assigning ownership to one person on your team, they are responsible for looking into all of the alerts on that dataset. This is a great data governance practice!
Once you’ve defined your global configuration, you need to define the configuration on the model level. The re_data data quality metrics will only be calculated for the models you have properly defined. These configs take two required variables: <span class="text-style-code-dark">re_data_monitored</span> and <span class="text-style-code-dark">re_data_time_filter</span>. For the first, you always want to set this to be true. Unless you are disabling monitoring.
As for <span class="text-style-code-dark">re_data_time_filter</span>, this refers to the date column that re_data should use to calculate metrics. You want to choose the timestamp that most accurately reflects when the data was generated. In the case of a transaction table, you would want to use the column that represents when the order was processed. However, with Google Sheets, we often don’t have this type of timestamp column available to use. In this case we will want to use the <span class="text-style-code-dark">_AIRBYTE_EMITTED_AT</span> column that is automatically generated when Airbyte syncs data.
My base model, <span class="text-style-code-dark">base_inventory_levels.sql</span>, looks like this:
{{
    config(
      re_data_monitored=true,
      re_data_time_filter='_AIRBYTE_EMITTED_AT'
    )
}}

Select * from {{ source(‘google_sheet’, ‘inventory_levels’) }}
Now we can run re_data as we would run a data model: <span class="text-style-code-dark">dbt run --m re_data</span>
You should see two new schemas created, RE and RE_INTERNAL, in the database where your dbt models run. These schemas contain more specific details related to the calculations of the metrics you defined. The only table you really want to pay attention to is RE_DATA_MONITORED within the RE schema because it contains the anomaly metrics that you will be alerted of.
Remember you need to add this model-level configuration to every model that you want metrics calculated for. As of now, row_count, freshness, and nulls_count metrics are only being calculated as defined in the global configuration for our <span class="text-style-code-dark">base_inventory_levels</span> model.
Download our free guide and discover the best approach for your needs, whether it's building your ELT solution in-house or opting for Airbyte Open Source or Airbyte Cloud.

While re_data does have a UI, I find its easiest to be alerted of any data anomalies directly on Slack. This way you don’t have to manually check a UI. If something goes wrong, you are directly alerted within a platform that you probably use every day. After all, if something is happening with your Airbyte connector, you want to know as soon as possible so you can fix it before it has any downstream impact.
re_data’s Slack notifications work using a webhook, so start by generating this for the channel you wish to send your alerts to. It is best practice to create a channel specific for data alerts. Your Slack alert command contains the webhook-url and a subtitle if you wish. You can also add a start and end date if you wish to be alerted of issues that happened a few days ago. However, the default is daily, which works great for our purpose.
re_data notify slack
--webhook-url https://hooks.slack.com/services/T00000000/B00000000/XXXXXXXXXXXXXXXXXXXXXXXX
--subtitle="Airbyte freshness and row_count checks"
I run this command as a dbt command within my data pipeline, just as you would run a dbt model. Whenever my pipeline runs, this command also runs alerting me of any anomalies.
re_data has built-in macros that we can utilize to clean our data directly within our dbt base models. Some of these include cleaning whitespaces and capitalizing letters.
Let’s start with the <span class="text-style-code-dark">clean_additional_whitespaces</span> dbt macro in this model. To ensure there are no whitespaces in our <span class="text-style-code-dark">product_code</span> column, we are going to run the macro on this column.
{{
    config(
      re_data_monitored=true,
      re_data_time_filter='_AIRBYTE_EMITTED_AT'
    )
}}

select
  {{ re_data.clean_additional_whitespaces('product_code') }} AS product_code,
  product_name,
  quantity_available,
  last_restocked_at,
  warehouse_code
from {{ source(‘google_sheet’, ‘inventory_levels’) }}"
As you can see, you reference the name of the macro as you do a source or other model within dbt. You feed the column name you wish to clean into the macro and re_data does all the work for you!
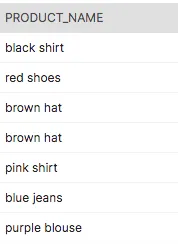
Now let’s see what the clean_capitalize_words dbt macro looks like when used on our <span class="text-style-code-dark">product_name</span> column. Right now you can see the the product names are all lowercase.

Similarly to the first macro, you simply reference its name and select the column you wish to use it on.
{{
    config(
      re_data_monitored=true,
      re_data_time_filter='_AIRBYTE_EMITTED_AT'
    )
}}

select
  {{ re_data.clean_additional_whitespaces('product_code') }} AS product_code,
  {{ re_data.clean_capitalize_words('product_name') }} AS product_name,
  quantity_available,
  last_restocked_at,
  warehouse_code
from {{ source(‘google_sheet’, ‘inventory_levels’) }}
Now let’s look at our data…

And,the product names are all capitalized!
Another helpful macro available within re_data is one called filter_remove_duplicates. The filter_remove_duplicates dbt macro removes duplicate rows from your dbt models that meet certain criteria. It takes three arguments: the dbt model you are removing the duplicates from, the list of columns that uniquely identify a row, and the order to sort partitioned rows.
In our case, we want to remove duplicates from the <span class="text-style-code-dark">base_inventory_levels</span> model. Here, product_code and warehouse_code make up a unique row. We will want to sort these by <span class="text-style-code-dark">last_restocked_at</span> DESC since we want the row with the most recent stock date.
{{
    config(
      re_data_monitored=true,
      re_data_time_filter='_AIRBYTE_EMITTED_AT'
    )
}}

select
  {{ re_data.clean_additional_whitespaces('product_code') }} AS product_code,
  {{ re_data.clean_capitalize_words('product_name') }} AS product_name,
  quantity_available,
  last_restocked_at,
  warehouse_code
from {{ re_data.filter_remove_duplicates(source('google_sheet', 'sheet1'), [['product_code'], ['warehouse_code']], ['last_restocked_at desc']) }}
This removes all but the most recent row if there are rows that have the same product_code and warehouse_code.
Now you are all set up to start monitoring and cleaning your Airbyte data using the re_data dbt package! These tools together provide a powerful start to ensuring you are ingesting the highest quality data. Airbyte provides reliable data to your data warehouse quickly while re_data helps to monitor and clean it at the source. This will help decrease downstream impacts within your data models. If you're looking to quench your thirst for learning, consider exploring our tutorial on SQL Data Cleaning for comprehensive insights.
Feel the spark of curiosity? Dive into this fascinating article exploring industry-proven best practices for designing a data ingestion pipeline!
If you want to easily try out Airbyte, you might want to check our fully managed solution: Airbyte Cloud. We also invite you to join the conversation on our community Slack Channel to share your ideas with thousands of data engineers and help make everyone’s project a success!

Madison Schott is an Analytics Engineer, author of The ABCs of Analytics Engineering book. Madison blogs about the modern data stack on Medium and writes a newsletter on Substack.

Madison Schott is an Analytics Engineer, author of The ABCs of Analytics Engineering book. Madison blogs about the modern data stack on Medium and writes a newsletter on Substack.
Download our free guide and discover the best approach for your needs, whether it's building your ELT solution in-house or opting for Airbyte Open Source or Airbyte Cloud.
